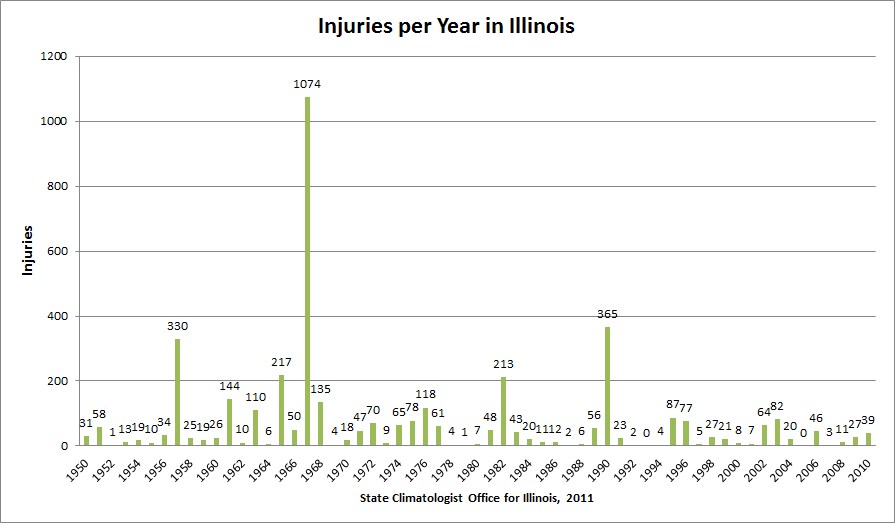
Recently, an undergraduate in the Department of Atmospheric Science at the University of Illinois helped me look at the tornado statistics for Illinois. Among the things we plotted were the number of deaths and injuries reported in Illinois since 1950.
The first thing you will notice in both the deaths and injuries per year are the standout years of 1967 and 1990. The high numbers in 1967 were due to the Belvidere-Oak Lawn tornado outbreak of April 21, 1967. The high numbers in 1990 were due to the Plainfield tornado of August 28, 1990. As events have shown this year, despite our best efforts at warnings and preparations, an EF-4 or EF-5 tornado in an urban area will create significant casualties.
The second thing you will notice is that there are no upward trends in the deaths and injuries per year in Illinois despite our population increasing from 8.7 million in 1950 to 12.8 million in 2010. Some earlier research on Illinois tornadoes has shown that while we are detecting more EF-0 tornadoes (the weakest category) due to improved technology, we are seeing about the same number of EF-1 to EF-5 tornadoes through time.
By the way, the “EF” or “Enhanced Fujita” scale rates tornadoes from EF-0 (weakest) to EF-5 (strongest) based on damage. See Enhanced Fujita scale for more information.


Links to Useful Severe Weather Websites
I enjoyed the opportunity to speak at Tom Skilling’s Severe Weather Seminar at Fermi Lab on Saturday, April 30. During my talk I mentioned some web sites that I use for looking at past severe weather events. As promised, I am posting them here for you to use.
Storm Prediction Center
In the “reports” section of the SPC website you will find day-to-day reports of severe weather with maps and tables describing the activity on each day. Farther down the page are reports and maps for each year and other products. I find this a real gold mine for severe weather information.
Screenshots (click to enlarge):

Experimental Local Storm Reports
The San Diego NWS site has “experimental” local storm reports presented with Google Maps. The interface allows to you to selected the kinds of weather reports you want to see on the map, as well as a date range. Icons are used to represent different types of events and you can click on them to get more details.
Screenshots (click to enlarge):

National Severe Storm Laboratory
The National Severe Storm Laboratory in Normal OK has two radar-derived products useful for severe weather studies: a) rotation tracks and b) MESH (Maximum Expected Size Hail). I found this site to be more of a challenge to use than some of the others. Even so, the results are spectacular as shown below with the rotation tracks from April 27-28, 2011.

Severe Weather On April 19, 2011
Thunderstorms moved across Illinois on Tuesday, April 19, 2011, causing widespread damage from tornadoes, hail, and high winds. See map below. In Illinois alone, there were 15 reports of tornadoes – six in Macoupin County, six in Montgomery County, two in Christian County, and one in Vermilion County.
Hail amounts up to 2.75 inches in diameter were reported as well. The 2.75 inch hail fell in Roodhouse in Green County, followed closely in size by 2.5 inch hail in Golden Eagle in Calhoun County. A complete list of storm reports for April 19 is found at the Storm Prediction Center page for April 19.
The NWS is now conducting damage surveys:
- St. Louis NWS office survey
[April 21: I added a map of SPC storm reports for the Midwest.]


Tornado Tracks in Illinois 1950-2010
Using data from the NOAA Storm Prediction Center, our GIS specialist Zoe Zaloudek created a map of tornado tracks in Illinois from 1950 to 2010. The tracks are color-coded from blue to red to purple for F0 to F5 tornado events. The map below gives a general idea of the tracks, the PDF file is at higher resolution so that you can see much more detail.
There are some outstanding features. Like earlier studies, central Illinois is the most active region of the state. There are relatively few tornadoes reported in the northwest and southeast corners of the state. It could be the terrain – more hills and woods makes it harder to see tornadoes. Or it could be that those areas are also less densely populated.
Another feature is the local “hot spot” in Kankakee and Will Counties, relative to surrounding counties. We see a similar pattern with heavy rainfall events so it is probably genuine, and not an artifact of the data collection.
We have noticed a few artifacts in the map and are working with SPC to get those resolved. For example, there are a few instances of the tracks forming a triangle.


