On Thursday, NOAA’s Climate Prediction Center released their outlooks for September and the 3-month period of September – November. For Illinois, they foresee an increased risk of above-normal temperatures and below-normal precipitation in September. Also, they foresee an increased risk of above-normal temperatures for September – November. They are taking a neutral stand on fall precipitation, saying that there are equal chances of above, below and near-normal precipitation.
The other news they have is that their drought outlook (second figure) shows expected improvement in the drought north of Interstate 74 in the upcoming months. Some improvement is expected in southern Illinois. However, they expect drought to persist in western Illinois through at least the end of November.


Rains Over the Last Week in Illinois – Good News for Some
Parts of Illinois received some welcome rains in the last week. The map below is a screenshot from a precipitation product provided by the Southern Region of the National Weather Service. This is based on high-resolution radar data, and corrected using the much sparser rain gauge network.
The areas in green received somewhere between an 1.0 to 2.5 inches, while the areas in tan or light yellow received over 3.0 inches. As a rule of thumb, we get about an inch of rain per week in August. So any area in green made small gains on the rainfall deficit for the season. Meanwhile those areas in blue received less than an inch and fall farther behind on the rainfall deficit for the season.
Locally, I got 0.68 inches at my house in Champaign over the weekend. In fact, I got more rain in the early morning hours of Sunday than in all of July. My guess is that soybean farmers will be happy with anything we can get in August.

Monthly Temperature and Precipitation Departures Since 2011 in Illinois
Here are the statewide Illinois monthly temperature and precipitation departures from the 1981-2010 average for both 2011 and 2012. We have had a run of above-average temperatures since October 2011 and a run of below-average precipitation since January of 2012. The latest outlooks published on June 30 by the National Weather Service shows that the odds of this pattern of warmer and drier conditions to prevail through July (bottom figure).


Dry Across the Midwest – 2012 Compared to 1988
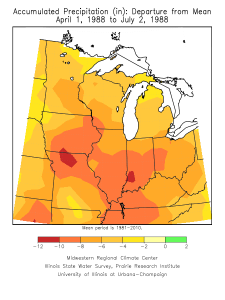
The current drought condition has many similarities with 1988. Here is the departure from normal precipitation for the Midwest from April 1 to July 2 for 2012 (left) and for 1988 (right).
Areas in green are doing well. Areas in blue are having to deal with flooding issues. Areas in yellow are dry, and areas in the darker shades of yellow, orange, and red are progressively drier.
This year the drought has missed parts of Minnesota, Wisconsin, and Michigan, where all the Midwestern states suffered in 1988. So far this year, the hardest hit area is in southern Illinois, southwest Indiana, western Kentucky and southeastern Missouri with departures of 8 to 12 inches (dark orange and red areas) since April 1. In 1988, those same conditions were seen over a wider area including large parts of northern Missouri, Iowa, Illinois, Indiana, western Kentucky, and eastern Ohio.


