What Follows a Warm March?

What follows a warm March in Illinois? Out of curiosity I looked at the other nine years in the list of 10 warmest months of March on record in Illinois (earlier post). First, I looked at the temperature and precipitation patterns for April. Then I looked at the May-August period as the heart of the growing season. Here are the results.
Disclaimer: while past years can give some insight on how the atmosphere has behaved over Illinois, they are not always the best forecast for the upcoming month, season, or year. Each new year brings a unique set of circumstances that causes things to play out differently than any previous year.

April

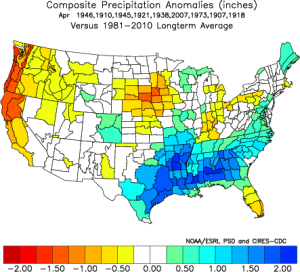
Historically, a warm March has been followed by a colder-than-normal April on average (first map). That’s true not just in Illinois but across the U.S. On the other hand, precipitation for those same April periods was a mixed bag in Illinois (second map). Most of the state was near-normal while west-central Illinois was slightly wetter-than-normal. It is interesting that dryness shows up in Minnesota, Iowa, Nebraska, and South Dakota – an area having trouble with drought this year.

Temperature departures in April following past warm March's in Illinois.

Precipitation departures in April following past warm March's in Illinois.

May – August

The period from May through August is the core of the growing season in Illinois. Rather than produce temperature and precipitation maps of each month, I considered the entire May-August period in one set of maps. One popular question I get is “Does this warm weather now mean that we will get a hot summer?” At least historically, the growing season following a warm March does not show a pattern of above-normal temperatures. On average, they have been remarkably mild in temperature. There is a tendency towards below-normal precipitation across much of Illinois and the Midwest. It’s nothing catastrophic, on average just an inch below normal in parts of eastern and northern Illinois. Meanwhile, southern Illinois is in an area of slightly above-normal precipitation.

Growing season temperature departures following warm March's in Illinois.

Growing season precipitation departures following warm March's in Illinois.

One last note, using an average of several years together may cover up any kind of bipolar personality where half the summers were extremely hot and half the summers were extremely cold. I did not seeing anything like that in this analysis. For example, in the nine cases of the growing season temperatures, four were slightly cooler than normal, two were near normal, two cases slightly warmer than normal, and only one case (1921) was well above normal (i.e., hot).

On Track for Record Setting March

March

[updated March 30, 2012]
Based on data through March 29, the statewide average temperature was 54.7 degrees, 14.1 degrees above normal. Of course, we still have March 30-31 to go but all indications are that the much above normal temperatures will continue. So here are the ten warmest March’s in the Illinois statewide records that date back to 1895:

  1. 2012: 54.7°F (as of March 29)
  2. 1946: 51.6°F
  3. 1910: 50.9°F
  4. 1945: 50.5°F
  5. 1921: 49.1°F
  6. 1938: 48.1°F
  7. 2007: 47.6°F
  8. 1973: 47.5°F
  9. 1907: 47.0°F
  10. 1918: 46.4°F

January-March

Here are the ten warmest January-March’s in the Illinois statewide records. In this case, 2012’s hold on first place is more tenuous. Here you will notice that the 2000s are on the list three times as are the 1990s.

  1. 2012: 40.8°F (as of March 29)
  2. 1921: 39.2°F
  3. 1990: 38.7°F
  4. 1946: 38.1°F
  5. 1938: 37.6°F
  6. 1998: 37.3°F
  7. 1992: 36.9°F
  8. 2006: 36.7°F
  9. 2000: 36.7°F
  10. 1973: 35.9°F

March – Near Average Temperature

Temperature

The statewide average temperature for Illinois in March was 41.0 degrees, just 0.1 degrees below the 1971-2000 average. Of course, temperatures varied widely from one week to the next. Take Chicago: on March 17, the high temperature was 67 degrees which is 20 degrees above average. A week later, the highs were in the low 30s and 11 to 12 degrees below average. Kaskaskia reported the highest temperature in Illinois for the month with 83 degrees, while Normal reported the lowest temperature for the month with 14 degrees.

Precipitation

The statewide average precipitation for March was 2.76 inches, 0.45 inches below the 1971-2000 average. Amounts ranged from 2 to 3 inches in northern Illinois, to 1 to 2 inches in central Illinois, and 3 to 6 inches in southern Illinois. The heaviest rainfalls were in far southern Illinois with Brookport reporting a monthly total of 8.14 inches and Cairo reporting 7.36 inches.

Snowfall

It is not unusual to get snowfall in March. Average snowfall in March typically ranges from about 2 inches in Carbondale to over 5 inches in Rockford and Chicago. This year, the only significant snow fell near St. Louis. Lebanon to the east of St. Louis reported 8.0 inches of snow; Waterloo to the southeast of St. Louis reported 6.2 inches.

Figures

march precipitation
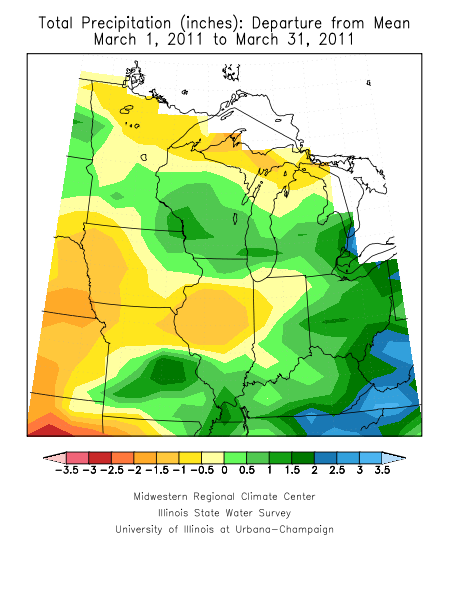
March 2011 precipitation across the Midwest.

march precipitation departure
March 2011 precipitation departure from the 1971-2000 average.

 
march 2011 snowfall
March 2011 snowfall.


March Was Warmer and Drier than Normal

Champaign, Ill. – Based on preliminary data in Illinois, the statewide average temperature for March was 43.6 degrees, 2.5 degrees above normal. This ends a three-month streak of colder than normal temperatures that occurred this winter, according to State Climatologist Jim Angel of the Illinois State Water Survey (http://www.isws.illinois.edu).
The statewide average precipitation was 2.8 inches, 0.4 inches below normal. A year ago, the March precipitation was 4.2 inches, an inch above normal, signaling the start of a very wet growing season.
This year, the January to March precipitation total was 5.8 inches, 1.4 inches below normal. Drier conditions this year have helped soil moisture return to conditions more typical for this time of year after an exceptionally wet fall.
The latest National Weather Service outlook for April calls for an increased chance of above normal temperatures across Illinois and the Corn Belt. An increased chance of above normal precipitation is indicated for the western Corn Belt, including western Illinois. The eastern half of Illinois has an equal chance of above, below, and near normal precipitation.
“March certainly came in like a lion and out like a lamb. The average statewide temperature on March 1 was 32 degrees but warmed up to 58 degrees on March 31,” concludes Angel.