Spring Flood Risk – Minor For Most of Illinois

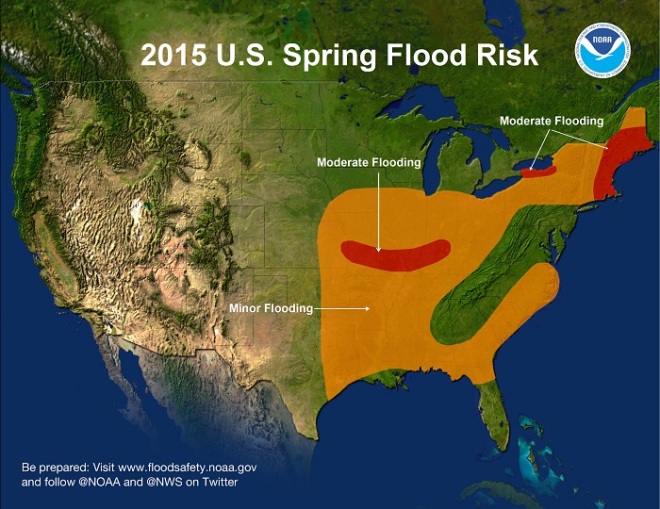
NOAA released their Spring Flood Risk today. According to their map, most of Illinois has a minor risk of flooding this spring. An area at risk of moderate flooding is seen in southern Illinois. Sorry for the non-transparent overlay on the map – their map, not mine.

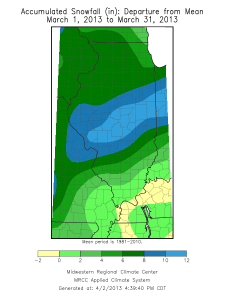
sfoThe good news of sorts is that much of the upper Midwest, including northern Illinois has been dry for the last 3-4 months. In the last few weeks, what snow cover we had in the central US is gone, as this map shows.
Continue reading “Spring Flood Risk – Minor For Most of Illinois”

March Cold and Dry in Illinois

Based on preliminary data, March 2014 in Illinois was cold and dry.

Temperature

The statewide average temperature was 33.8 degrees, which was 7 degrees below average and the 8th coldest March on record. Combined with the colder-than-average January and February made this the 4th coldest start (23.6 degrees) for Illinois for the year to date.

This was the fifth month in a row with temperatures much below average in Illinois. At this point, it was the second coldest November-March on record for Illinois at 29.1 degrees. See the bar graph below showing monthly temperature departures since January 2013.

If this cold March felt familiar, it was because last March was cold as well. The statewide average temperature for March 2013 was only 34.1 degrees.

image004

Precipitation

The statewide average precipitation was 1.49 inches, which strangely enough was 1.49 inches below average and the 11th driest on record. The statewide average precipitation last March was much higher at 2.74 inches. Eight out of the last nine months have had below-average precipitation. As a result, the statewide precipitation departure since July 1 was 7.2 inches.

image011


The first map below is the accumulated precipitation for March (rain plus the water content of any snow event). Most of the state received between 1 to 2 inches of precipitation. It was wettest in the far south and driest in the northwest.

The second map shows the precipitation departures from average for March, showing all areas of the state with below-average precipitation. This would be of more concern if March had been warm. However, with the colder conditions very little drying took place.

Snowfall

The third map shows the snowfall for March. Amounts were in the 1 to 5 inch range in the southern half of the state and 5 to 15 inches or more in the northern half. Mendota reported the highest monthly total of 17.9 inches.

The fourth map shows the snowfall departure from average for March. The entire state was above-average on snowfall for the month. While it seems like a contradiction to report above-average snowfall and below-average precipitation for March, it really is not. The problem is that we have had few rainfall events in March, which was unusual. So we ended up with a lot of snow but the water content of all that snow did not make up for the lack of rain. map_btd


map_btd (1)

map_btd (2)

map_btd (3)


Ten Coldest March's and What Follows

As previously reported, based on preliminary data this March in Illinois was 34.1 degrees and the 11th coldest March on record. What were the ten coldest March’s on record? I have listed them in the table below. Also I looked to see what happened in April after these chilly March’s. It turns out that half are above average and half are below average – a virtual coin toss.
The columns labeled “Depart” are the departures from the 1981-2010 statewide averages. Probably the biggest turnaround was between March 1960, which was the coldest March on record and 15.5 degrees below average, compared to April 1960 which was 2.2 degrees above average. The statewide temperature records go back to 1895. 

Rank Year March Depart April Depart
1 1960 25.6 -15.5 54.6 2.2
2 1906 30.3 -10.8 54.5 2.1
3 1912 30.4 -10.7 52.6 0.2
4 1965 31.1 -10.0 52.9 0.5
5 1984 33.0 -8.1 49.8 -2.6
6 1932 33.2 -7.9 52.1 -0.3
7 1978 33.5 -7.6 52.5 0.1
8 1989 33.5 -7.6 51.1 -1.3
9 1947 33.8 -7.3 51.0 -1.4
10 1926 34.0 -7.1 45.4 -7.0
11 2013 34.1 -7.0 ?? ??

BTW, so far this April has been cool. The first 7 days averaged 44.4 degrees statewide, and about 3 degrees below average.

March – Much Colder Than Last Year

The preliminary numbers are in – the statewide temperature for March of this year was 34.1 degrees. That is 7 degrees below the long-term average of 41.1 degrees and the 11th coldest March on record. That is in remarkable contrast to March 2012, which ended up at 55.3 degrees. That March was 14.2 degrees above the long-term average and the warmest March on record. In fact, the difference between this March and last March was a whopping 21.2 degrees.
The statewide precipitation was 2.85 inches, which is 0.15 inches below the long-term average of 3.00 inches. Precipitation amounts were largest just east of St. Louis and lightest in east-central Illinois. The largest monthly total came from Kaskaskia with 6.42 inches of precipitation. Several surrounding sites had in excess of 5 inches.
[updated 4/11/13] Snowfall was above-average for the month thanks mostly to a large storm that passed through central Illinois on March 24-25 and some earlier events that passed through northern and western Illinois. The Springfield COOP site received 17 inches in 24 hours, a new 24-hour record for that site, and a storm total of 18.5 inches. They finished the month with 19.6 inches of snow. The CoCoRaHS site at Nokomis (IL-MY-1), to the south of Springfield, had a similar experience with 19 inches of snow from the one storm and a monthly total that tied Springfield with 19.6 inches. A CoCoRaHS site at Springfield (IL-SG-17) reported 18 inches during the one storm and a monthly total of 19.5 inches.
Precipitation totals and departures from the long-term average for March:

Click to enlarge.
Click to enlarge.

Click to enlarge.
Click to enlarge.

Snowfall totals and departures from the long-term average for March:
Click to enlarge.
Click to enlarge.

Click to enlarge.
Click to enlarge.