Last week the Illinois office of the National Agriculture Statistics Service released their report on crop yields in Illinois. The full report can be found here.
As expected, the Illinois corn yield for 2012 was only 105 bushels per acre, 52 bushels below last year. They noted that this was the lowest yield since 1988, when the average yield was only 73 bushels per acres. Because of the severe conditions of the corn crop, almost twice as many acres were harvested for silage in 2012 than in 2011.
Illinois soybean yield for 2012 was 43.0 bushels per acre, down 4.5 bushels from 2011. This was the lowest soybean yield since 2003, when the average yield was only 37.0 bushels per acre. While too late to do much good for corn, rains in the second half of August and the remains of Hurricane Isaac over Labor Day weekend may have provided some benefit to soybeans.
The one bright spot in the Illinois report was winter wheat production. The yield in 2012 was 63 bushels per acre, up 2 bushels from 2011. However, only 660,000 acres were seeded in the fall of 2011, which is down 140,000 acres from the previous fall. I suspect the decline was due in part to the already dry conditions experience in southern Illinois – the primary production area of the state.
January in Illinois – Wet Despite the Lack of Snow
The preliminary numbers are in and the statewide precipitation was 3.9 inches, 1.9 inches above average. Most of the state was in the 3 to 6 inch range except for some drier areas in central and western Illinois. It was wettest in southeastern Illinois with several sites with over 6 inches, including Smithland Lock and Dam on the Ohio River with 9.7 inches. By the way, the precipitation amount includes both rain events and the water equivalent of any snow.
Snowfall for January was below average and ranged from 6.5 inches in the northwest corner to zero in far southern Illinois (second map).
Even though January finished with below-average snowfall, it was offset with above-average rainfall in many areas. The impact of these rains were discussed in an earlier post. As a result, the U.S. Drought Monitor has reduced the area in drought or abnormally dry conditions since January 1 (last figure) by 11 percent.
The statewide temperature for January was 28.7 degrees, four degrees above average. It was far short of the warmest January on record that was established in 2006 with 37.9 degrees and followed closely by 1933 with 37.7 degrees.


Widespread Rain Across Illinois
I was driving back from a meeting yesterday and saw creeks that were bank full and water standing in fields. That’s the first time I’ve seen those sights in a while, maybe over a year ago in this part of Illinois (Champaign County).
In the last 7 days, widespread rainfall amounts of 1 to 3 inches have been reported across the state. See the map below. This is a National Weather Service product that combines high-resolution radar estimates calibrated with rain gauge measurements (see map below). The heaviest rains fell in northern Illinois, an area considered to have been in some stage of drought earlier this week. Because some of the rain fell after the cutoff for this week’s Drought Monitor, I would expect to see the effects of these rains in next week’s map.
Another bit of good news is that the soils appeared to be unfrozen across most of the state during this rain event, thanks to the warm temperatures early in the week. See the second map below from our network of 19 soil temperature sites across Illinois. As a result, much of this rain should have had a chance to soak in and recharge the soil moisture profile.
Finally, the abundant and widespread rainfall across the state has increased the flow in streams and rivers across the state. Many stream gauges report levels that are in the upper 90th percentile for this time of year. In fact, the National Weather Service has reported some minor flooding along the Kaskaskia and Little Wabash Rivers. The result is that much more water is flowing into the critically low Mississippi River. The Mississippi River stage at Chester Illinois (below St. Louis) has risen seven feet and is expected to rise another four feet in the next day or two (last figure).
While the recent rains should provide some temporary relief for barge traffic on the Mississippi River, levels are expected to start dropping again in a few days. The larger problem is that about 80 percent of the Missouri River and Upper Mississippi River basins are in some stage of drought, according to the U.S. Drought Monitor. Until those two basins are in better shape, concerns with Mississippi River flows will remain for some time.


Illinois in 2012 – Second Warmest and Tenth Driest on Record
2012 Summary
The year 2012 will long be remembered for the drought and the exceptionally warm temperatures. While the data for December is still preliminary, it was the second warmest and tenth driest year on record for Illinois.
The statewide average temperature for 2012 was 55.5 degrees, 3.3 degrees above normal and the second warmest year on record for Illinois. The warmest year was 1921 with 55.6 degrees. Temperatures were much warmer than normal in January-May, July, and December (figure below). For some places in Illinois it was the warmest year on record, including Chicago and Rockford (see story here).
The statewide average precipitation for 2012 was 30.37 inches. That was 9.83 inches below normal and the 10th driest year on record in Illinois. The normal annual precipitation in Illinois is 40.20 inches. Precipitation was much drier than normal in May-July and November (figure below). Here is how 2012 compared with other dry years:
- 1901 – 26.34″
- 1930 – 27.88″
- 1963 – 28.00″
- 1953 – 28.05″
- 1914 – 28.58″
- 1976 – 28.84
- 1940 – 29.33″
- 1988 – 29.71″
- 1936 – 30.24″
- 2012 – 30.37″
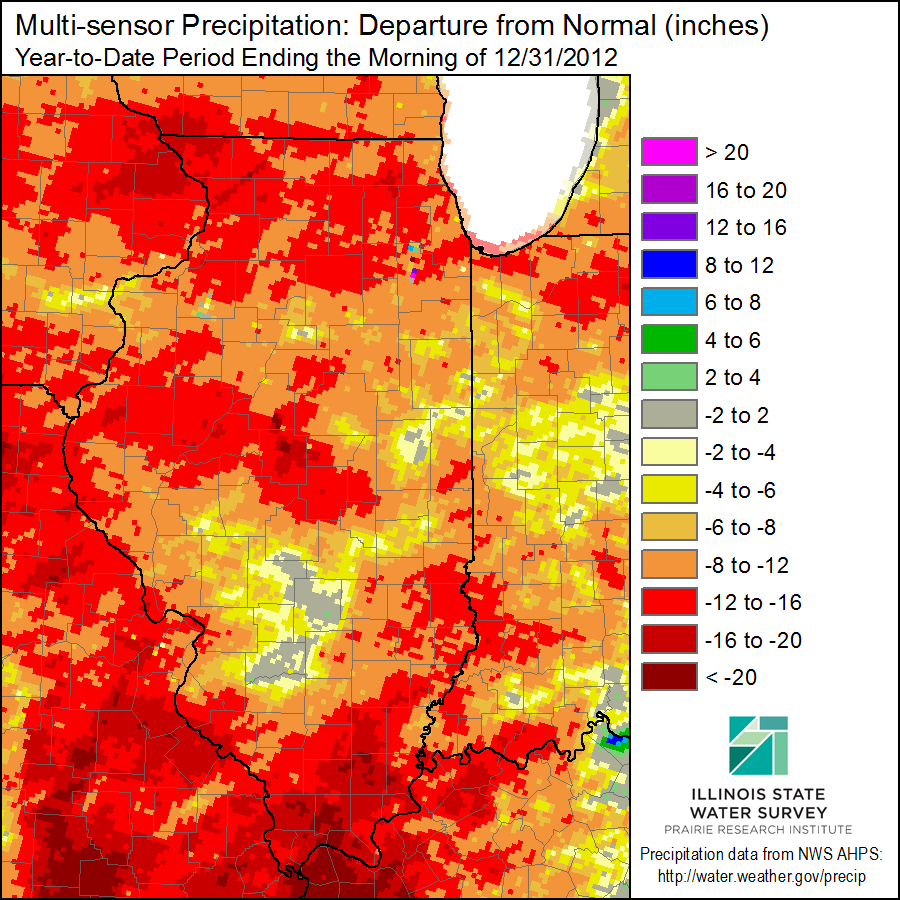
The map of the precipitation departures from normal across the state (below), as of December 31, 2012, shows large areas of the state with deficits in the range of 8 to 16 inches below normal (the darker tan and bright red colors) for 2012.
Unfortunately, winter is our driest time of year in Illinois. The normal precipitation for January and February is 2.11 and 2.12 inches, respectively. Even March is not much wetter at 2.98 inches. That adds up to 7.21 inches for those three months combined. It would take something close to record precipitation in January (6.92 inches), February (4.46 inches), and March (7.53 inches), for a total of 18.91 inches, to erase the deficits accumulated in 2012.
December 2012
The statewide average precipitation for December 2012 was 2.34 inches, just 0.4 inches below normal.
The statewide average temperature for December 2012 was 35.8 degrees, 5.9 degrees above normal and the 13th warmest December on record. The warmest December on record was 1923 with 39.7 degrees.
Figures