What are the chances of a White Christmas (defined as at least an inch of snow on the ground on Christmas Day)? The National Climatic Data Center has updated their US map to show the current 1981-2010 averaging period. The odds are high in the Rocky Mountains, the upper Midwest, and the Northeast. However, a White Christmas is rarely, if ever, seen in much of the southern half of the US or along the West Coast.
We did a similar map with more detail for Illinois last year (second map). It should come as no surprise that the highest odds are in northern Illinois. In general, the odds are about 40-60 percent in the northern third of Illinois, 20-40 percent in central Illinois, and 0-20 percent in southern Illinois.
There can be large differences from site to site. Snowfall is notoriously difficult to measures with two nearby sites having different results due to exposure to sun and wind.


2nd Warmest January to November on Record for Illinois
The statewide average temperature in Illinois for January to November this year was 57.3 degrees, based on preliminary data. That is 3.1 degrees above normal and the second warmest on record back to 1895. Only 1921 was warmer with 57.6 degrees. This was in spite of a fall where the statewide average temperature was 52.7 degrees and 1.5 degrees below normal. Most of the above-normal warmth occurred in the January to July time frame. See graph below.
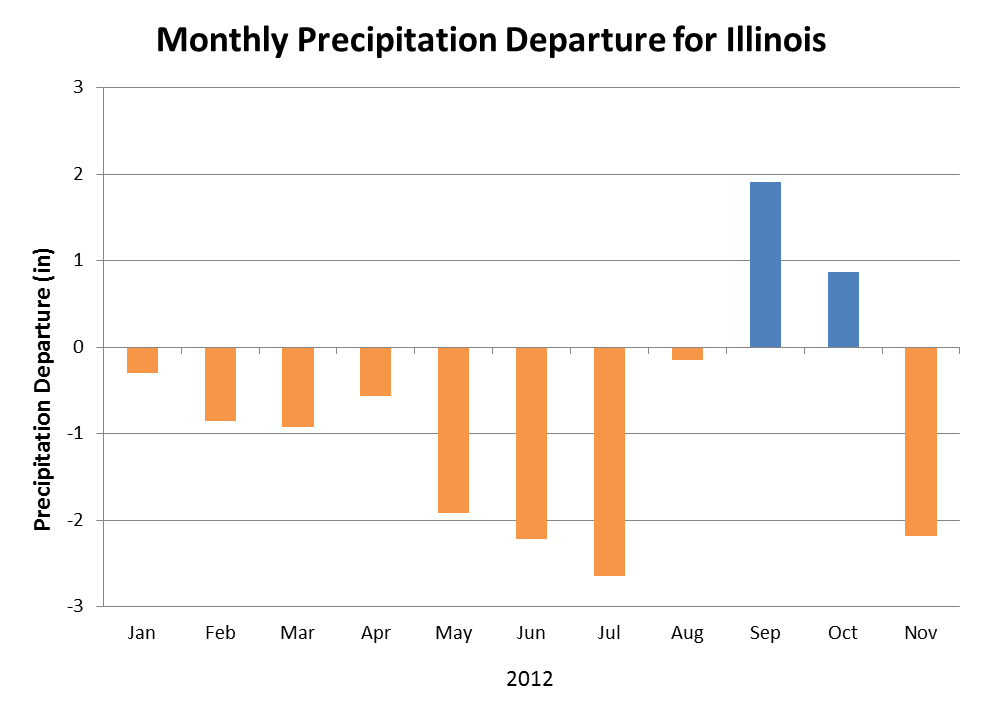
As mentioned earlier, the statewide average precipitation in Illinois for January to November this year was 27.6 inches and the 12th driest on record. This was in spite of a fall where the statewide average precipitation was 10.13 inches, 0.16 inches above normal. The graph below illustrates the beginning of a drought recovery in September and October before the dry November.