October in Illinois – Cool and Wet

October

October 2012 was cooler and wetter than normal in Illinois. The statewide average precipitation was 3.94 inches, 0.68 inches above normal. The wettest area of the state was between Quincy and Champaign where precipitation totals ranged from 4 to 7 inches. Some of the driest areas were in southern Illinois south of I-64 and in northern Illinois north of I-80. Some of that area had precipitation totals of less than 3 inches. See map below.
The statewide average temperature was 52.2 degrees, 1.9 degrees below normal. Most of the state reached lows of 32 degrees, and much of central and northern Illinois were down to 28 degrees, signalling the end of the growing season for most outdoor plants.

Year to Date

The statewide average precipitation for January-October was 27.1 inches, nearly 5.8 inches below average. This made it the 15th driest January-October and virtually tied with 2005. The driest was in 1901 with 21.99 inches. The second driest was 1988 with 22.10 inches.
The statewide average temperature was 58.9 degrees, 3.4 degrees above normal. That made it the second warmest on record. The warmest was 1921 with 59.2 degrees.
**All temperature and precipitation amounts are preliminary and may change as more data arrives.

October precipitation.

Year to date precipitation deficits. Areas east of St. Louis and in east-central Illinois have managed to erase the severe precipitation deficits from earlier in the year.

Dry October in Illinois

Precipitation

The statewide average precipitation for October in Illinois was 1.79 inches, 1.12 inches below average or 61 percent of average. That makes it the 21st driest October on record back to 1895. See map below.
Amounts of less than an inch were common in western Illinois. The driest spot for October in Illinois was Colchester (near Macomb) with 0.22 inches for the month. The wettest spot in Illinois was Lansing (south Chicago) with 5.22 inches.
Moderate to severe drought remains in western Illinois, according to the U.S. Drought Monitor. The National Weather Service has predicted above-average precipitation for November across Illinois. Combined with cooler temperatures, this should lead to improvements in that area of the state.

Temperature

The statewide average temperature for October in Illinois was 55.1 degrees, just 0.5 degrees above average. The highest temperature for October in Illinois was 92 degrees at Bentley on October 8. The lowest temperature was 23 degrees at Mt. Carroll on October 29. Most of Illinois experienced temperatures at or below freezing by the end of the month.

Snowfall

No measurable snow reported yet. I’m sure that will change in November.

October precipitation
October precipitation (inches) for 2011 in Illinois. Click to enlarge.

October precipitation departure
October precipitation departure (inches) for 2011 in Illinois. Click to enlarge.

Sunny and Dry Start to October

The first 10 days of October have been warm, dry, and sunny in Illinois.  The statewide average temperature is 61.3 degrees, 3.8 degrees above average.
The statewide average precipitation is zero. Only a handful of sites in far western Illinois have reported anything. The highest total so far in the state was 0.44 inches from a CoCoRaHS site near Carthage, Illinois.
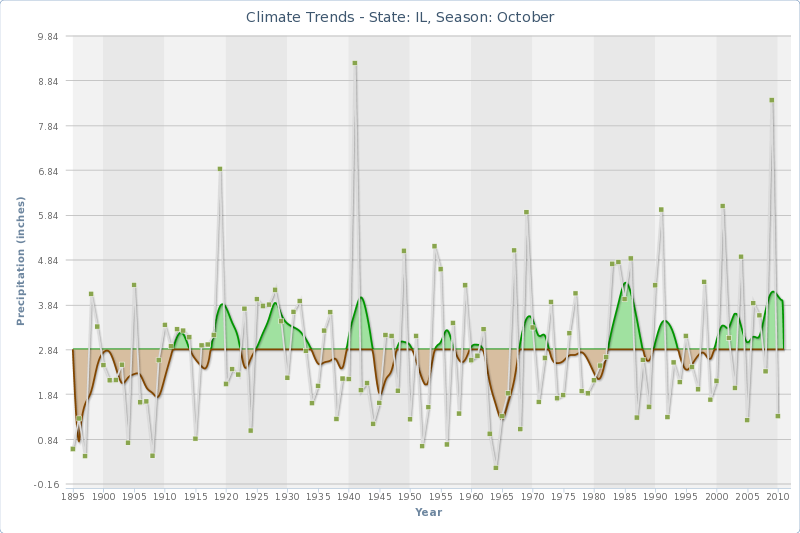
The driest October on record in Illinois was 1964 with only 0.20 inches for the entire month. Last year (2010) was the 19th driest October with only 1.35 inches. However, October 2009 was second wettest with 8.40 inches.
Here is a look at how October precipitation has behaved since 1895 in Illinois. The green dots are the individual years. The alternating brown and green shaded area show below and above average precipitation, respectively. The average is based on the period of record (1895-2010). You can see a lot of year to year variability in the numbers and no clear long-term trends.

October precipitation in Illinois from 1895 to 2010. Click to enlarge.

October and Fall – Warm and Dry in Illinois

The NWS Climate Prediction Center has released their outlooks for October and October-December. For Illinois there is an increased chance that temperatures will be above-average in both the October and October-December time frames. Also there is an increased chance that precipitation will be below-average in both October and October-December.
As posted earlier, this forecast is consistent with the known impacts of the rejuvenated La Niña event occurring in the Pacific Basin. La Niña tends to give us warmer and drier than average conditions in fall. Last fall was a classic example of this with temperatures 1.2 degrees above average and precipitation 12% below average.

seasonal outlook
The October and October-December outlooks of temperature and precipitation from the NWS Climate Prediction Center. Click to enlarge.