Monthly Temperature and Precipitation for 2015 in Illinois

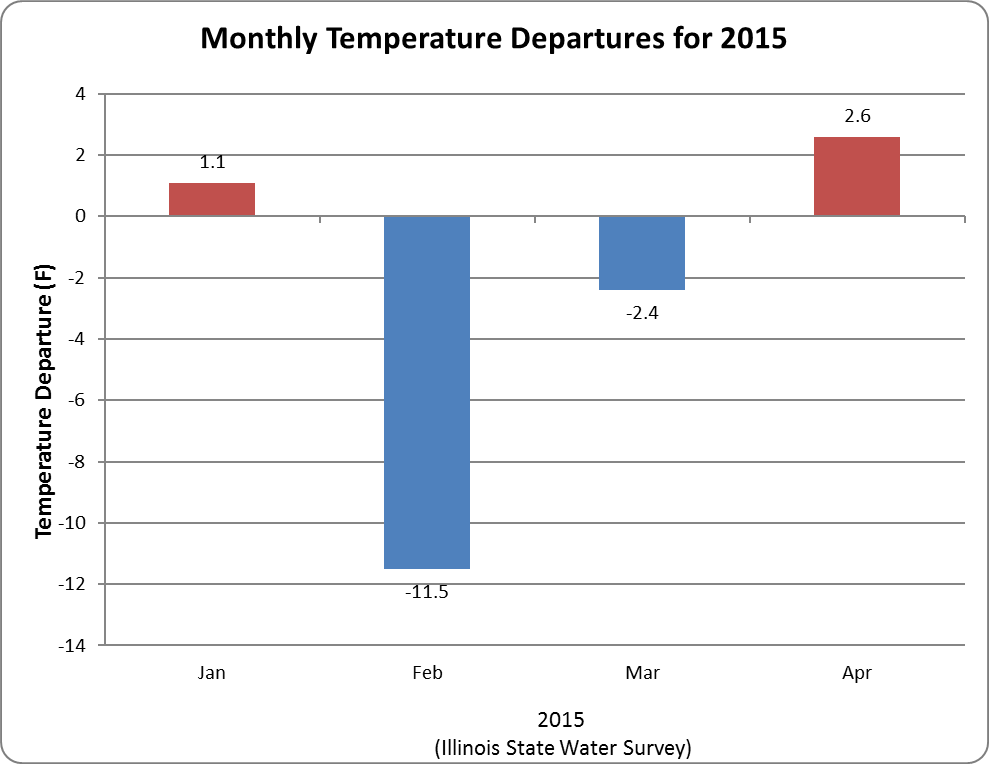
How things are shaping up in 2015? The outstanding features so far are the extremely cold February and the extremely wet conditions in southern Illinois while dry elsewhere.

Monthly Temperature Departures from Average

Blue means colder than average, red means warmer than average. Temperature departures from average tend to cover very large areas, making the statewide average temperature departure a good indicator of conditions around Illinois.

image027

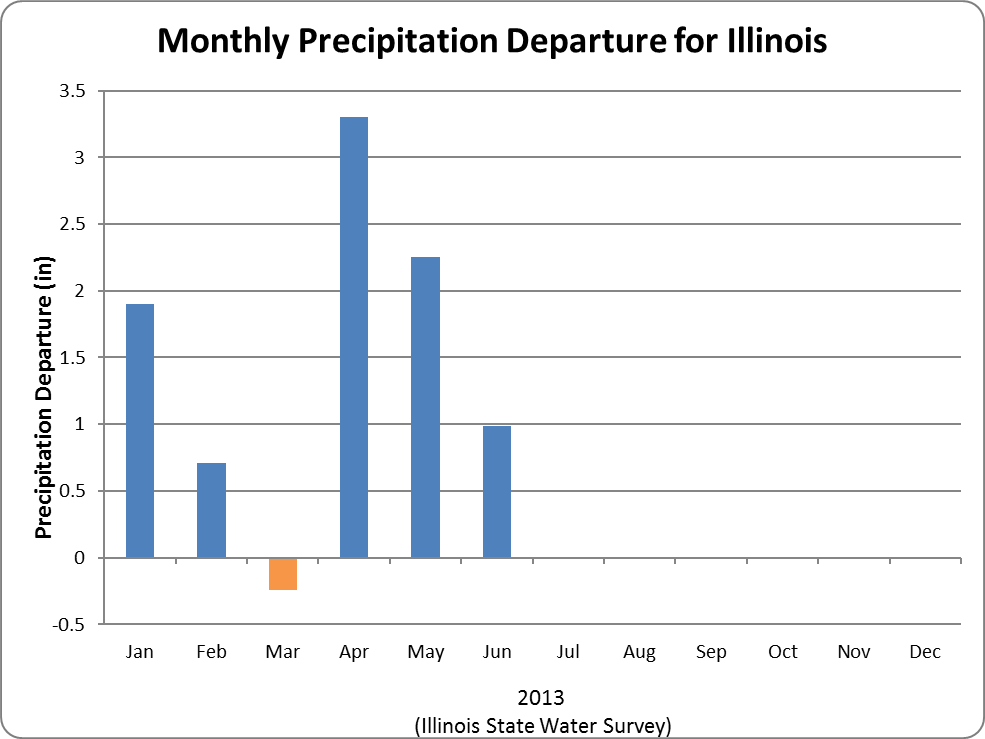
Monthly Precipitation Departures from Average

Continue reading “Monthly Temperature and Precipitation for 2015 in Illinois”

2013 – Month by Month in Illinois

For 2013 in Illinois, here are the graphs of monthly temperature and precipitation departures from the 1981-2010 average, through the end of June. In terms of temperature, the two standout months were the mild January and the chilly March. For precipitation, all but March have had above-average precipitation. These are statewide numbers so your experience may differ from this.
One situation we have run into is that several sites have received more precipitation in the first six months of 2013 than they did in all 12 months of 2012. For example,

  • Havana received 25.49 inches in 2012, and 35.35 inches in the first half of 2013.
  • Quincy received 24.56 inches in 2012, and 27.30 inches in the first half of 2013.
  • Peoria received 27.08 inches in 2012, and 29.71 inches in the first half of 2013.
  • Moline received 27.25 inches in 2012, and 29.29 inches in the first half of 2013.
  • Rockford received 23.35 inches in 2012, and 27.16 inches in the first half of 2013.
  • Chicago received 26.91 inches in 2012, and 28.46 inches in the first half of 2013.

image001
image013