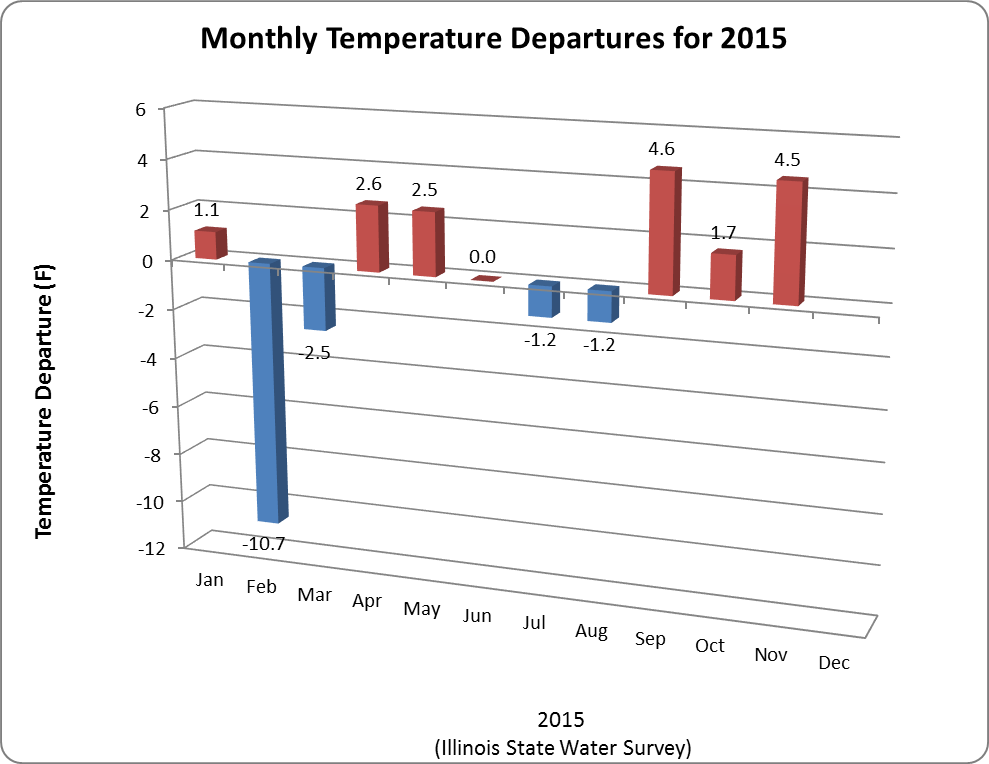
Temperature
This was the 5th warmest November on record for Illinois, based on preliminary data. The statewide average temperature was 47.4 degrees, and 4.9 degrees above normal. Here are the top ten warmest Novembers in Illinois since 1895:
- 2001 with 49.9°F
- 1931 with 49.1°F
- 1909 with 48.8°F
- 1999 with 48.4°F
- 2016 with 47.4°F
- 2009 with 47.2°F
- 1902 with 46.9°F
- 1990 with 46.8°F
- 2015 with 46.6°F
- 1913 with 46.4°F
It was also the 2nd warmest fall on record for Illinois. The statewide average temperature for fall was 59.4 degrees, 5 degrees above normal. Only the fall of 1931 was warmer at 59.8 degrees. The climatological fall months are September, October, and November.
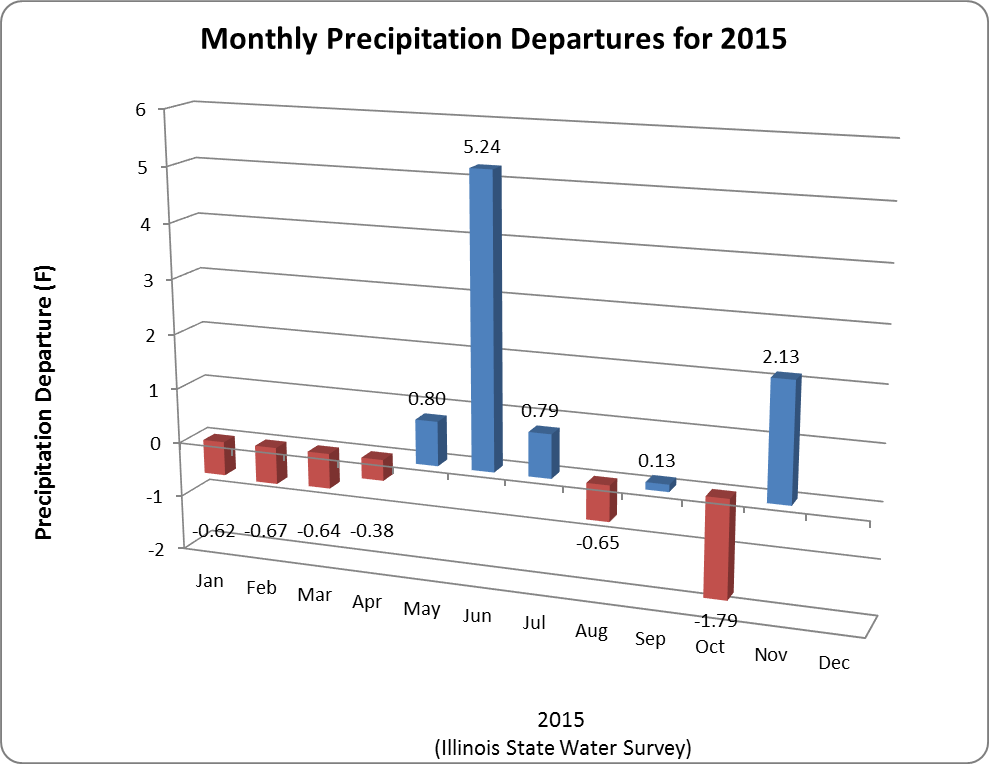
Precipitation
Continue reading “5th Warmest November, 2nd Warmest Fall in Illinois”