Year to Date – Cool and Wet in Illinois

It is probably not shocking news to find out that the first 8 months of 2014 have been both cooler and wetter than average for Illinois.

The statewide average temperature for January-August was 50.8 degrees, 3.5 degrees below the 1981-2010 average and tied with 1924 as the fifth coolest on record.

The statewide average precipitation for January – August was 28.79 inches, 1.46 inches above average and the 34th wettest on record.

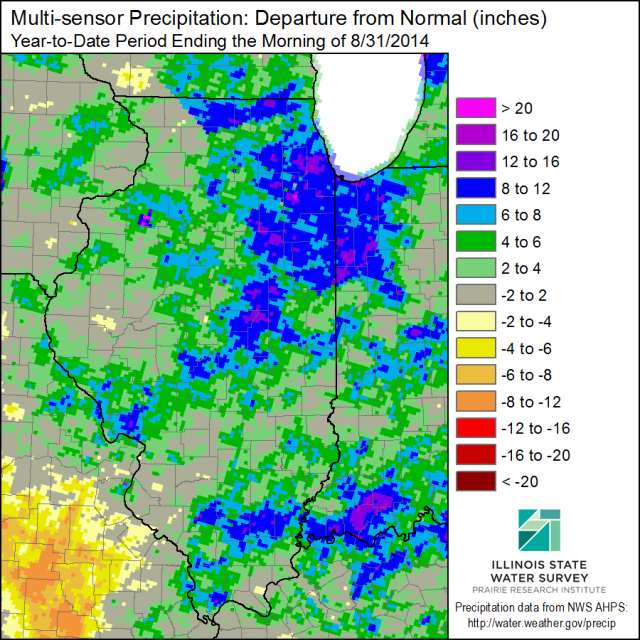
Here is what the precipitation departures look like through the end of August. Several areas in northeast and east-central Illinois have precipitation departures of 6 to 12 inches above average in the shades of blue, and a few areas with 12 to 16 inches above average. Areas in green are 2 to 6 inches above average. Only a few small areas in tan/beige are 2 to 4 inches below average.

IL-prcp-mpe-y2d-dev-20140831

Wet August Wraps Up Cool, Wet Summer in Illinois

Highlights: The 12th wettest August in Illinois finishes out the 10th wettest summer on record. While August was slightly warmer than average, the summer was cooler than average. Here are the statistics.

August Statistics

The statewide average precipitation for August was 5.18 inches, 1.59 inches above average and the 12th wettest on record. The wettest area of the state was Cook County. The largest monthly total was from a CoCoRaHS site (IL-CK-100) in Cicero with 10.20 inches of precipitation.

This first map shows several areas across the state with amounts of 7 to 10 inches (oranges and reds), according to radar estimates. There were a few areas in the northwest and east-central Illinois with only 2 to 3 inches. The second map shows the departures from average, showing the many areas with 2 to 8 inches above average for the month.

IL-prcp-mpe-m2d-tot-20140901


Continue reading “Wet August Wraps Up Cool, Wet Summer in Illinois”