4th Coldest Winter in Illinois and What Follows

I have received several questions about whether or not this winter is an indicator of the upcoming growing season. The good news is that, at least historically, a harsh winter is not followed by a harsh summer.

Analysis

The statewide average temperature for the three core winter months of December, January, and February was 20.8 degrees. That was 8.2 degrees below average and the fourth coldest December-February period on record. Here is how it compared with some other cold winters in Illinois.

Rank Year Avg.
1 1977-1978 19.6
2 1978-1979 19.9
3 1935-1936 20.6
4 1917-1918 20.8
4 1976-1977 20.8
4 2013-2014 20.8

By the way, the 1981-2010 statewide average is 29.0 degrees.

So what followed after these harsh winters? We will look at the winters of the late 1970s first. The plot below shows the monthly temperature departures from average for Illinois. After the first of the three harsh winters, we had a remarkably warm spring in 1977, followed by summer and fall temperatures close to average. The temperatures in 1978 and 1979 were even closer to average. Not shown here, but the precipitation during the growing season of those three years was close to average as well. Overall, the growing seasons were unremarkable in both temperature and precipitation.

image001

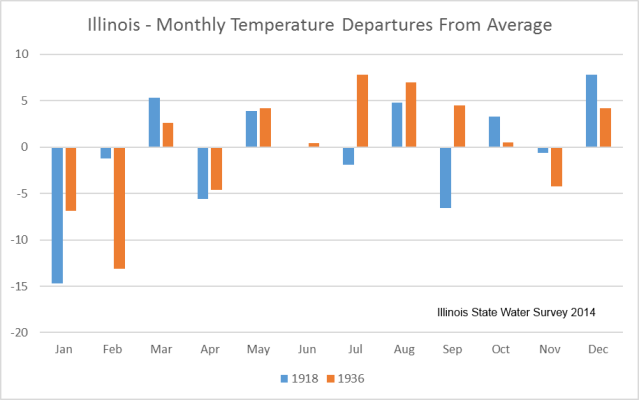
Here is the same analysis (plot below) for the two other harsh winters in the list: 1918 and 1936. The interesting thing about 1918 as the persistent alternation between warmer- and colder-than-average conditions from one month to the next. Precipitation for 1918 was one inch below average. Of course, 1936 is infamous for both the drought and heat that summer. That is clearly seen in the July, August, and September temperatures on the graph.

So of the five harsh winters in the analysis, we have only one case of a following summer showing harsh conditions. Another analysis I did offline with winter and summer temperatures showed zero correlation between the two.

image003

February Seventh Coldest on Record

feb2014-floodedfield
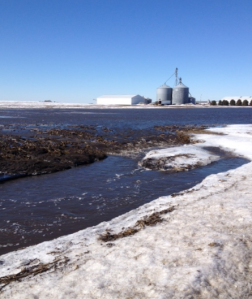
Flooded farm field in east-central Illinois after a period of snowmelt and rainfall in the third week of February, 2014.

Based on preliminary data, the Illinois statewide temperature for February was 18.7 degrees. That was 12.1 degrees below the long-term average and the seventh coldest February on record. No surprise there.

The statewide average temperature for the three core winter months of December, January, and February was 20.8 degrees. That was 8.2 degrees below average and the fourth coldest December-February period on record. Incidentally, it is in a 3-way tie with 1917-18 and 1976-77. The coldest winter was 1977-78 at 19.6 degrees. The winter of 1978-79 was in second place at 19.9 degrees. Overall, this winter was comparable to those in the late 1970s.

Below is the table of the ten coldest February’s on record for Illinois. It’s really hard to beat those cold February’s in the late 1970s. The 1981-2010 statewide average is 30.8 degrees.

Rank Year Avg.
1 1978 16.9
2 1979 17.5
3 1936 17.7
4 1905 17.8
5 1895 18.1
6 1899 18.5
7 2014 18.7
8 1902 19.3
9 1914 20.9
10 1958 21.4

Here are the ten coldest December-February periods in Illinois since 1895. The 1981-2010 statewide average is 29.0 degrees.

Rank Year Avg.
1 1977-1978 19.6
2 1978-1979 19.9
3 1935-1936 20.6
4 1917-1918 20.8
4 1976-1977 20.8
4 2013-2014 20.8
5 1903-1904 21.6
6 1962-1963 21.9
6 1904-1905 21.9
7 1981-1982 22.8

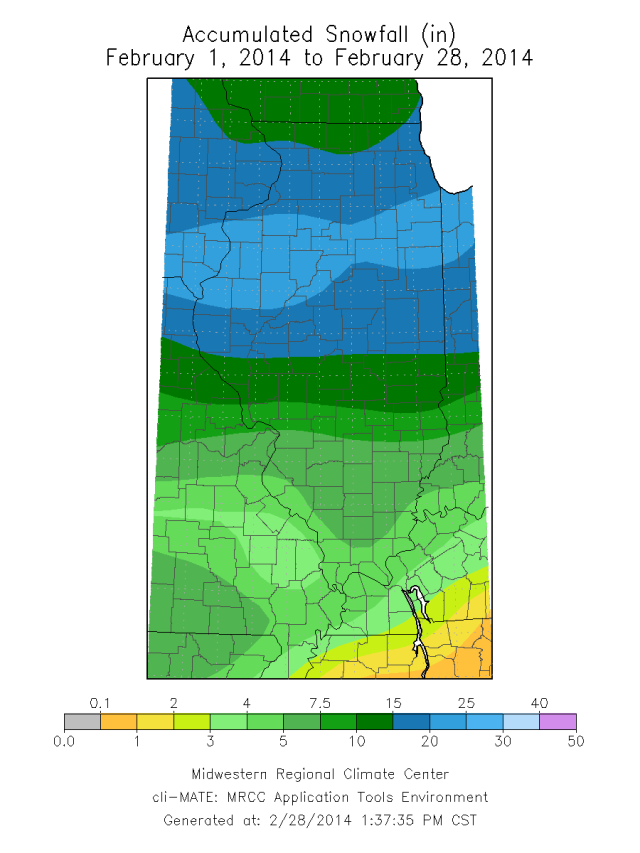
The snowfall for February was above average across the state. The total snowfall ranged from 4 inches in far southern Illinois to 15-20 inches in north-central Illinois. The snowfall departures from average ranged from 1-5 inches south of Interstate 70 and between 10 and 18 inches between Interstates 70 and 80.

feb-snowfeb-snow-dep

The statewide precipitation for February was 2.28 inches. That was just 0.17 inches above average. Precipitation includes both rain events along with the water content of any snowfall. The result in February was that the above-average snowfall did not translate to above-average precipitation because several of those snowfall events occurred in colder conditions when snow density is lower (i.e, fluffier).

By the way, here are the snowfall totals for the entire snowfall season. You may recall that we saw snow flurries back in October and some measurable snow in November. Some of largest snowfall totals this winter are in the Chicago area and include Lincolnwood with 79.8 inches and Oak Park with 78.6 inches.

win-snowwin-snow-depart