Here are the monthly temperature and precipitation departures from the long-term average by month in Illinois for 2013. After a warmer-than-average January, temperatures have been below-average in February, March, and April. Monthly precipitation has been above-average in January, February, and April, but slightly below-average in March.
This is a far cry from the first four months of 2012 which were noteworthy for being both above-average on temperatures and below-average on precipitation. See the second pair of figures for 2012.


Comparison of 2012 to 1988 in Illinois
Precipitation
The first figure shows the statewide precipitation departures by month for both 1988 (blue) and 2012 (red) in Illinois, using the 1981-2010 average as normal. There are several interesting features:
- the period from January to March was actually drier in 2012 than 1988;
- the 1988 drought started abruptly in April with dramatically less precipitation; April 2012 was dry but less so than February or March;
- the precipitation departures in May and June of 1988 were slightly more severe (1/2 inch drier for each month) than 2012;
- by the end of June, the precipitation deficit was 7.83 inches in 1988 and 7.25 inches in 2012;
- while less severe than June, precipitation continued to be below normal from July to October in 1988; real relief did not arrive until November.

Monthly precipitation departure in Illinois for 1988 (blue) and 2012 (red). Click to enlarge.
Temperature
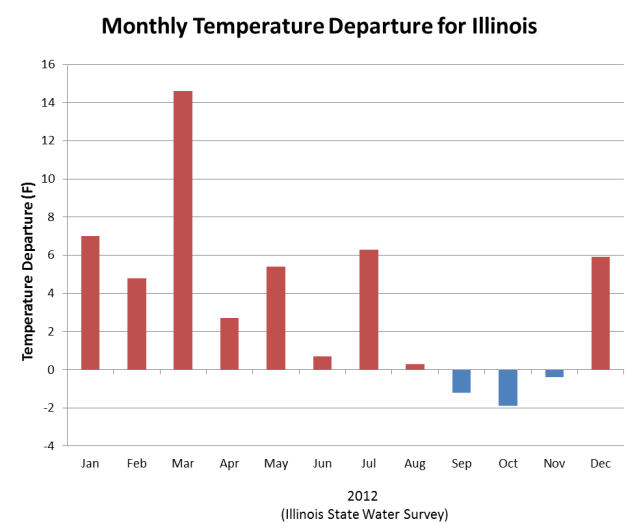
The next figure shows the statewide temperature departures by month for both 1988 (blue) and 2012 (red) in Illinois. There are several interesting features here as well:
- temperatures from January to March in 2012 were much warmer than normal while they were much cooler than normal in 1988; in fact, January and February was significantly colder in 1988;
- temperatures in April, May, and June were all above normal in 2012;
- it wasn’t until May that temperatures in 1988 started to be warmer than normal;
- warmer than normal temperatures continue in 1988 until October.

Summary
In summary, the 1988 drought started later than the 2012 drought, but once started it was more intense in the April-June period. However, temperatures were much warmer in 2012 than in 1988. In my opinion, those two factors balance out, making the the 1988 and 2012 very comparable at this point.
How is July unfolding? For the first 17 days of July, the precipitation amounts are identical between 1988 and 2012 at 0.8 inches (40% of normal for that period). However, temperatures for the first 17 days of July 1988 averaged 79.1 degrees, 3.3 degrees above normal. For this July, the average temperature was 82.3 degrees, 6.5 degrees above normal.
Dry Across the Midwest – 2012 Compared to 1988
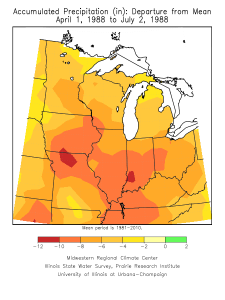
The current drought condition has many similarities with 1988. Here is the departure from normal precipitation for the Midwest from April 1 to July 2 for 2012 (left) and for 1988 (right).
Areas in green are doing well. Areas in blue are having to deal with flooding issues. Areas in yellow are dry, and areas in the darker shades of yellow, orange, and red are progressively drier.
This year the drought has missed parts of Minnesota, Wisconsin, and Michigan, where all the Midwestern states suffered in 1988. So far this year, the hardest hit area is in southern Illinois, southwest Indiana, western Kentucky and southeastern Missouri with departures of 8 to 12 inches (dark orange and red areas) since April 1. In 1988, those same conditions were seen over a wider area including large parts of northern Missouri, Iowa, Illinois, Indiana, western Kentucky, and eastern Ohio.


