Cooling Degree Days Up in Illinois This Year

As of August 16, cooling degree days (CDD) are well above normal this year in Illinois. The statewide average is 1051 CDDs, which is 268 CDDs above normal or 134 percent of normal. Last year the statewide average through this date was only 640 CDDs.

Cooling Degree Day accumulations at selected cities.
City Accumulated Departure from Normal Percent of Normal
Chicago 961 +284 145%
Rockford 778 +175 129%
Moline 1028 +278 137%
Peoria 1044 +280 137%
Quincy 1123 +294 135%
Springfield 1214 +338 139%
St Louis 1583 +442 139%

Cooling degree days are calculated by subtracting the mean daily temperature by 65 degrees. Results above zero are accumulated over time. So if the mean temperature for the day was 75 degrees, then 75 – 65 = 10 cooling degree days. Accumulated over a season and compared to normal gives a relative idea of potential cooling costs. The higher the number, the higher the cooling costs.
Other factors that can influence cooling costs are humidity levels and solar radiation. Personally, I ran the A/C at home pretty much every day since mid-May. Last year I ran it for about two weeks the entire summer.

Maps for July 2010

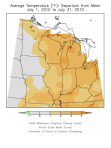
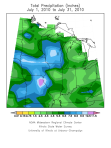
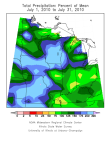
Here are the thumbnail maps (click to enlarge) of July temperature departures, and July rainfall and rainfall departures. It was warmer than normal across much of eastern Corn Belt. It was much wetter than normal across much of the western Corn Belt.

July temperatures in the Midwest
July temperature departures from normal for the Midwest.

July rainfall in the Midwest.

July rainfall departures for the Midwest.
July rainfall departures from normal for the Midwest.

July – Warmer and Wetter than Normal

The average temperature for July in Illinois was 77.7 degrees, 1.9 degrees above normal. That’s warm but not record-breaking by any means. By contrast, the average temperature of last July was 70.2 degrees. Not only was this year warmer but it was considerably more humid as well.
The average rainfall for July in Illinois was 5.6 inches, 1.8 inches above normal. BTW, the wettest July on record was 1958 with 8.03 inches.
The largest rainfall totals occurred in western and far northern Illinois as well as an area along I-70. Amounts of 8 to 12 inches were common in these areas.
Southern Illinois was much drier in July with amounts of only 1 to 3 inches in many locations. In fact, the US Drought Monitor categorized southern Illinois as being “abnormally dry” by. Another area of dryness is through central Illinois in an area bound by Moline, Kankakee, Danville, Springfield, and Peoria.

Warmer and Mostly Wetter July (so far)

The statewide average temperature for July 1-22, 2010, in Illinois is 77.2 degrees, 1.1 degrees above normal for this time period. The state average precipitation for the same period is 3.46 inches, 0.70 inches above normal.
Northern and eastern Illinois are a little drier on average. However, even those drier areas contain locations with very impressive rainfall amounts.

Midwest Rainfall
Midwestern rainfall for the period July 1-21, 2010. Map courtesy of NOAA's Midwestern Regional Climate Center.

Table 1. Temperature and precipitation amounts and departures from normal by climate division in Illinois for July 1-22, 2010. A map of the climate divisions can be seen below the table.

Climate Division Temperature (F) Depart (F) Rainfall (in) Depart (in)
Northwest 75.2 1.2 1.96 -0.86
Northeast 76.2 2.3 1.44 -1.41
West 76.9 0.4 6.54 3.58
Central 76.7 1.1 2.85 0.04
East 76.2 1.2 2.08 -0.88
South Southwest 77.5 0.4 5.05 -0.88
South Southeast 78.0 0.9 5.10 2.25
Southwest 79.3 1.0 2.89 0.39
Southeast 79.3 1.0 2.90 0.39
State 77.2 1.1 3.46 0.70
Illinois Climate Divisions
Illinois Climate Divisions (coincides with crop reporting districts as well).