Frost in spring is a concern to farmers, landscapers, and gardeners. Frost in Illinois is usually not measured directly at weather stations. Instead, it is inferred from the air temperature – when the air temperature crosses the threshold of 32°F.
The average date of the last spring occurrence of 32°F ranges from April 7 in far southwestern Illinois to April 28 in northern Illinois (see map below). The actual date can vary from year to year. The spring dates are getting earlier by about 5-10 days over the last few decades.
The actual date varies from year to year. For tender plants, add two weeks to the average date in the spring to protect against late season frost.
Although 32°F is the temperature traditionally used to show frost, visible frost can be seen on the ground and objects when temperatures are slightly above 32°F on calm, clear nights that allow cold, dense air to collect near the ground. Under these conditions, the temperature near the ground actually can be a few degrees cooler than at the 5-foot height of the official National Weather Service thermometer.
Open, grassy areas are usually the first to experience frost, while areas under trees are more protected because the trees help prevent the heat from escaping. Homeowners can protect tender plants by providing this same type of protection if they cover their plants when a frost is expected. Plants near heated buildings sometimes are spared too. Because of the abundance of warm buildings and trees in towns, they tend to experience frost less often than those living in the country.

Tornado Tracks in Illinois 1950-2010
Using data from the NOAA Storm Prediction Center, our GIS specialist Zoe Zaloudek created a map of tornado tracks in Illinois from 1950 to 2010. The tracks are color-coded from blue to red to purple for F0 to F5 tornado events. The map below gives a general idea of the tracks, the PDF file is at higher resolution so that you can see much more detail.
There are some outstanding features. Like earlier studies, central Illinois is the most active region of the state. There are relatively few tornadoes reported in the northwest and southeast corners of the state. It could be the terrain – more hills and woods makes it harder to see tornadoes. Or it could be that those areas are also less densely populated.
Another feature is the local “hot spot” in Kankakee and Will Counties, relative to surrounding counties. We see a similar pattern with heavy rainfall events so it is probably genuine, and not an artifact of the data collection.
We have noticed a few artifacts in the map and are working with SPC to get those resolved. For example, there are a few instances of the tracks forming a triangle.

Soil Temperatures in Illinois
With the arrival of spring, Illinois farmers are monitoring soil temperatures for decisions in the field. And the soil temperatures are on the rise.
The ISWS Water and Atmospheric Resources Monitoring (WARM) Program records soil temperatures at 4 and 8 inches under grass at 19 sites across the state. In addition, 4-inch bare soil temperatures are computed to represent a cultivated field. These data are available in map and tabular form for the past 7 days at http://www.isws.illinois.edu/warm/soiltemp.asp.
As of April 6, the 4-inch soil temperatures under grass during the day are into the upper 40s in northern Illinois, the low to mid 50s in central Illinois, and the mid 50s in southern Illinois. At night they are cooling off by about 4 to 6 degrees.
The statewide soil temperatures give a general idea of conditions; however, soil temperatures in an individual field will depend on factors such as soil moisture and tillage practices. Also, soil temperatures at the surface will warm up and cool off faster than in deeper layers.
March – Near Average Temperature
Temperature
The statewide average temperature for Illinois in March was 41.0 degrees, just 0.1 degrees below the 1971-2000 average. Of course, temperatures varied widely from one week to the next. Take Chicago: on March 17, the high temperature was 67 degrees which is 20 degrees above average. A week later, the highs were in the low 30s and 11 to 12 degrees below average. Kaskaskia reported the highest temperature in Illinois for the month with 83 degrees, while Normal reported the lowest temperature for the month with 14 degrees.
Precipitation
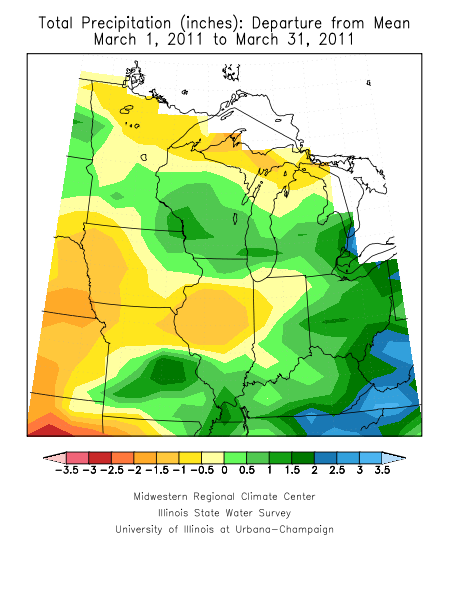
The statewide average precipitation for March was 2.76 inches, 0.45 inches below the 1971-2000 average. Amounts ranged from 2 to 3 inches in northern Illinois, to 1 to 2 inches in central Illinois, and 3 to 6 inches in southern Illinois. The heaviest rainfalls were in far southern Illinois with Brookport reporting a monthly total of 8.14 inches and Cairo reporting 7.36 inches.
Snowfall
It is not unusual to get snowfall in March. Average snowfall in March typically ranges from about 2 inches in Carbondale to over 5 inches in Rockford and Chicago. This year, the only significant snow fell near St. Louis. Lebanon to the east of St. Louis reported 8.0 inches of snow; Waterloo to the southeast of St. Louis reported 6.2 inches.
Figures


