Illinois and US Tornado Statistics for 2014 So Far

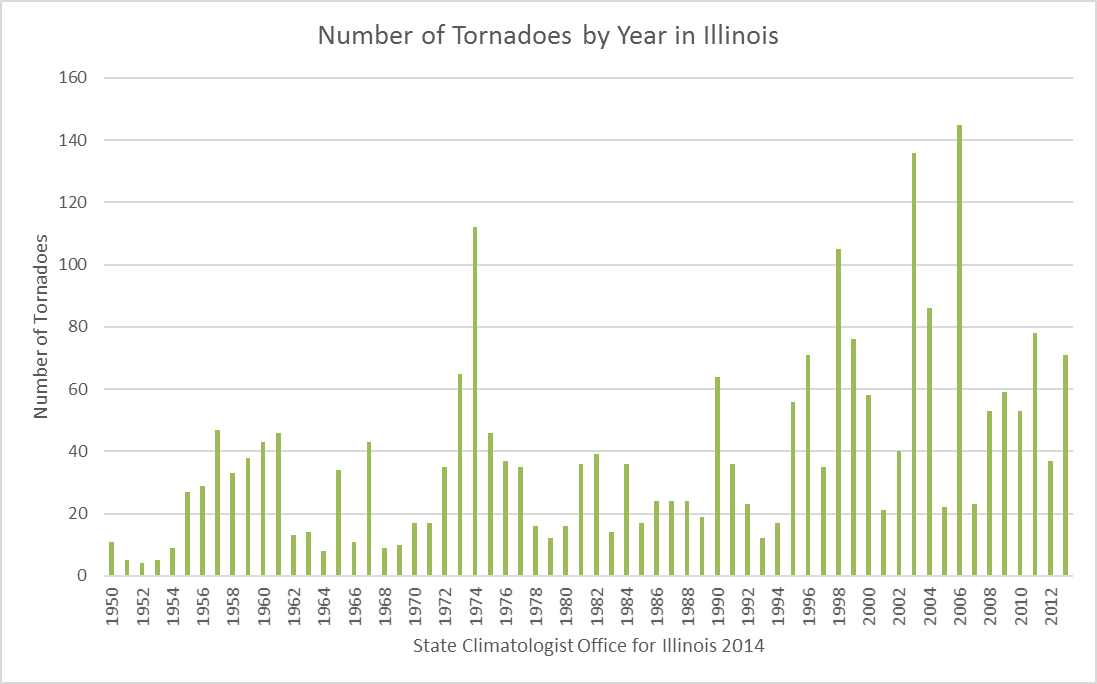
Illinois Tornado Statistics

So far, we have had 30 tornado reports in Illinois for 2014*, according to initial reports from the NOAA Storm Prediction Center. Nearly half of those were from the tornado outbreak of February 20th. Our five-year average is 59.

*Of course, 2013 was a quiet year until the November 17th outbreak that struck Illinois.

Normally, our core tornado season is March-June with about two-thirds of our tornadoes occurring then. This year was very quite during that period, I think in part due to the colder spring weather. Here is the tornado count by month:

  • January: 0
  • February: 14
  • March: 0
  • April: 4
  • May: 2
  • June: 2
  • July: 0
  • August: 0
  • September: 0
  • October: 7

Here are the event reports from the National Climatic Data Center through the end of July. This database contains some edits to the initial data from the Storm Prediction Center so the totals may not line up between the two sources. You can recreate this report with working links to each event at: http://www.ncdc.noaa.gov/stormevents/

Storm Events NCDC

US Tornado Statistics

Here is the distribution of the tornadoes for 2014 and the graph of accumulated tornado totals by year for the past 10 years, according to the NOAA Storm Prediction Center. Right now the national count is 998 tornadoes, which is below the ~1300 average through this date. The number of tornado-related deaths this year is 45, compared to 55 in 2013 and 70 in 2012.

2014_annual_map_torn
Initial reports of tornadoes in Illinois and across the US for the period of January 1 to October 27, 2014. Source: NOAA Storm Prediction Center.
torngraph-big
Here are the accumulated annual tornado totals for the past 10 years for the US. Right now we are at 998 tornadoes through October 27 (black line on graph). That puts us below average and on track with 2005 and 2012. Interestingly, those two years saw drought problems in the Midwest and the Plains states. Source: NOAA Storm Prediction Center.

Tornado Trends in Illinois – Updated

2014-03-21photo1The tornado trends in Illinois has been updated to include data through 2013. The plots in order are the number of tornado reports by year, deaths by year, and injuries per year. Click to enlarge each plot.

These plots are based on storm data at the National Climatic Data Center (NCDC). Tornado records are notorious for not being consistent over time. It is nobody’s fault – technology changes and reporting techniques have improved over time. The newer NWS Doppler radar systems were installed in the 1990s, the spotter networks continue to improve, and everyone has a cell phone with a camera.  As a result, the number of tornadoes has increased in recent years with the better accounting.

In addition, there is always the potential for over-counting the number of tornadoes as they travel. For example, you might have a report for a tornado spotted 2 miles west of Smithville, and then another report 10 minutes later of a tornado north of Smithville. Was this the same tornado or two separate ones? Hard to tell without supporting evidence, especially before the modern-day radars.

I think the number of deaths and injuries by year in Illinois may actually be more reliable than the tornado frequency because they were just as widely reported in the media in the 1950s and 1960s as they are today. One can clearly see the spike in 1967 due to the Oak Lawn/Belvidere tornado outbreak and the 1990 spike from the Plainfield tornado. Sadly, the last two years have been bad in terms of fatalities in Illinois – 2012 with 9 deaths (Harrisburg, IL) and 2013 with 8 deaths (November 17, 2013 outbreak) after 7 relatively quiet years.

If you want to look at US trends, check out the NCDC page on tornado trends.

tornado-year

fatal-year

injury-year