I have created a new web page that contains the monthly precipitation totals during the 2011 drought, along with links to the 1980-2010 normals (where available). I will keep this page updated as we move into fall.
Link: The 2011 Drought in Illinois
August – Drought in Central Illinois
The statewide average precipitation was 2.06 inches, 1.6 inches below average and 56 percent of average. This was the 13th driest August on record since 1895, based on preliminary data.
The driest area was south of and parallel to Interstate 74 (Figure 1). Rainfall amounts in that region were generally an inch or less. One of the driest spots in Illinois was Lovington (Moultrie County in east-central Illinois) with only 0.03 inches for the entire month. Other familiar sites with extremely low readings included: Decatur with 0.15 inches, Springfield with 0.25 inches, and Quincy with 0.25 inches.
Only northern Illinois received average to above-average rainfall in August (Figure 2). One of the wettest spots in Illinois was Morris (Grundy County) with 7.02 inches, followed closely by Earlville (LaSalle County) with 7.01 inches.
Moderate to severe agricultural drought arrived in Illinois in August (Figure 3), according to the US Drought Monitor. This was the result of much less than average rainfall in July and August, as well as warmer than average temperatures. Damage to corn and soybean crops appears to be significant in places. However, the full extent of the damage will not be known until harvest.
Temperatures were above average for much of Illinois (Figure 4). Highs in the 90s and even low 100s were common across the state. The hottest spots in the state were Cairo with 103 degrees on August 4 and Bentley with 103 degrees on August 25. Both Quincy and Grand Chain Dam were close with 102 degrees on August 2 and August 4 respectively.
The statewide mean temperature (an average of both the high and low temperatures) was 74.9 degrees, 1.2 degrees above average.


VegDRI: A view of Illinois corn and soybean crops from space
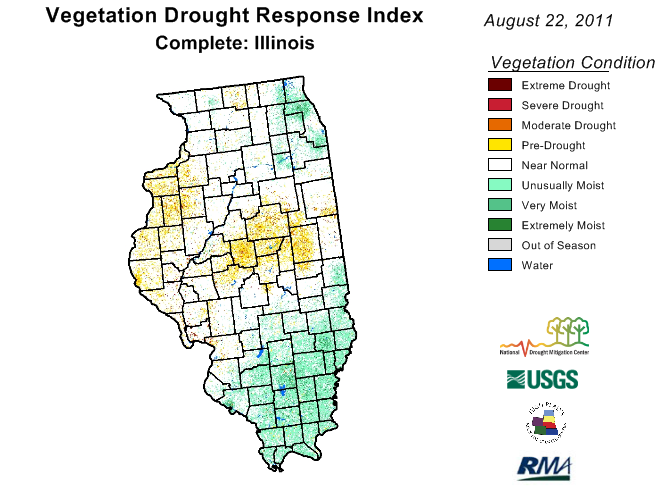
There is a new way to look at drought stress in Illinois – from space. Called VegDRI, this product integrates “satellite-based observations of vegetation conditions, climate data, and other biophysical information such as land cover/land use type, soil characteristics, and ecological setting. The VegDRI maps that are produced deliver continuous geographic coverage over large areas, and have inherently finer spatial detail (1-km resolution) than other commonly available drought indicators such as the U.S. Drought Monitor,” according to the VegDRI website.
In other words, it looks at crop stress as it relates exclusively to drought. The maps are updated every two weeks.
The August 22, 2011, map below shows that crops in much of western and central Illinois are showing much stress from the lack of rain and high temperatures in July and August. If you go to the VegDRI website, you can see a national map. Click on a state to get a closer view. Scroll down the state page and click on the quadrant map of the state so see even more detail.


The National Drought Mitigation Center produces VegDRI in collaboration with the US Geological Survey’s (USGS) Center for Earth Resources Observation and Science (EROS), and the High Plains Regional Climate Center (HPRCC), with sponsorship from the US Department of Agriculture’s (USDA) Risk Management Agency (RMA). Main researchers working on VegDRI are Dr. Brian Wardlow and Dr. Tsegaye Tadesse at the NDMC, and Jesslyn Brown with the USGS, and Dr. Yingxin Gu with ASRC Research and Technology Solutions, contractor for the USGS at EROS.
Extreme Dryness in August for Much of Illinois
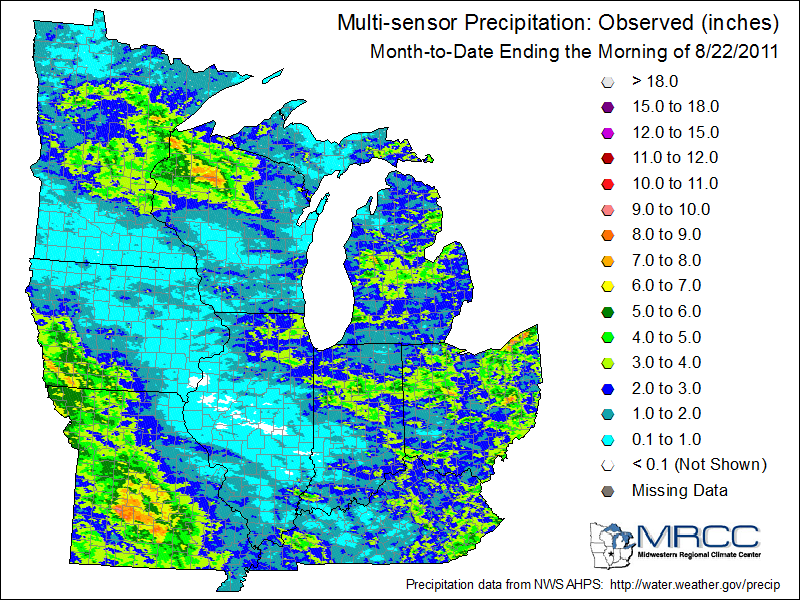
While the rains continue in northeastern Illinois, much of the rest of the state has been bone dry in August. Rainfall totals range from 3-5 inches in the Chicago area to less than an inch in many locations across central and southern Illinois. This band of dryness extends from southern Minnesota, eastern Iowa, Illinois, and into parts of Indiana and Kentucky (see first map).
Rainfall departures are on the order of 1-2 inches below average in the driest areas. Some of those same areas received little rainfall in July. The US Drought Monitor has much of central and southern Illinois in at least “moderately dry” with “moderate drought” in the central region of the state.
Of particular concern to me is that the few opportunities for substantial rain in August across central Illinois have resulted in only scattered showers/thunderstorms at best. There is another chance of rain on Tuesday/Wednesday but the projected amounts are on the order of 0.25 inches or less.
Update: USDA, National Ag Statistics Service (NASS) released the following on Illinois topsoil moisture (percent) by crop reporting district:
| District | Very Short | Short |
|---|---|---|
| Northwest | 4 | 21 |
| Northeast | – | 18 |
| West | 49 | 44 |
| Central | 31 | 38 |
| East | 40 | 44 |
| West Southwest | 26 | 58 |
| East Southeast | 13 | 46 |
| Southwest | 20 | 40 |
| Southeast | 30 | 56 |
| State | 25 | 41 |


