Tornado Plots for Illinois
Using tornado statistics provided by the National Centers for Environmental Information here we explore the relationship of selected tornado characteristics with hour of the day, month of the year, from year to year, etc. This was part of a Capstone project by Michael Patrick, a senior (2011) in the Department of Atmospheric Science at the University of Illinois. All the plots have been updated through 2020. Click any plot to enlarge.
Tornadoes, Fatalities, and Injuries by Year
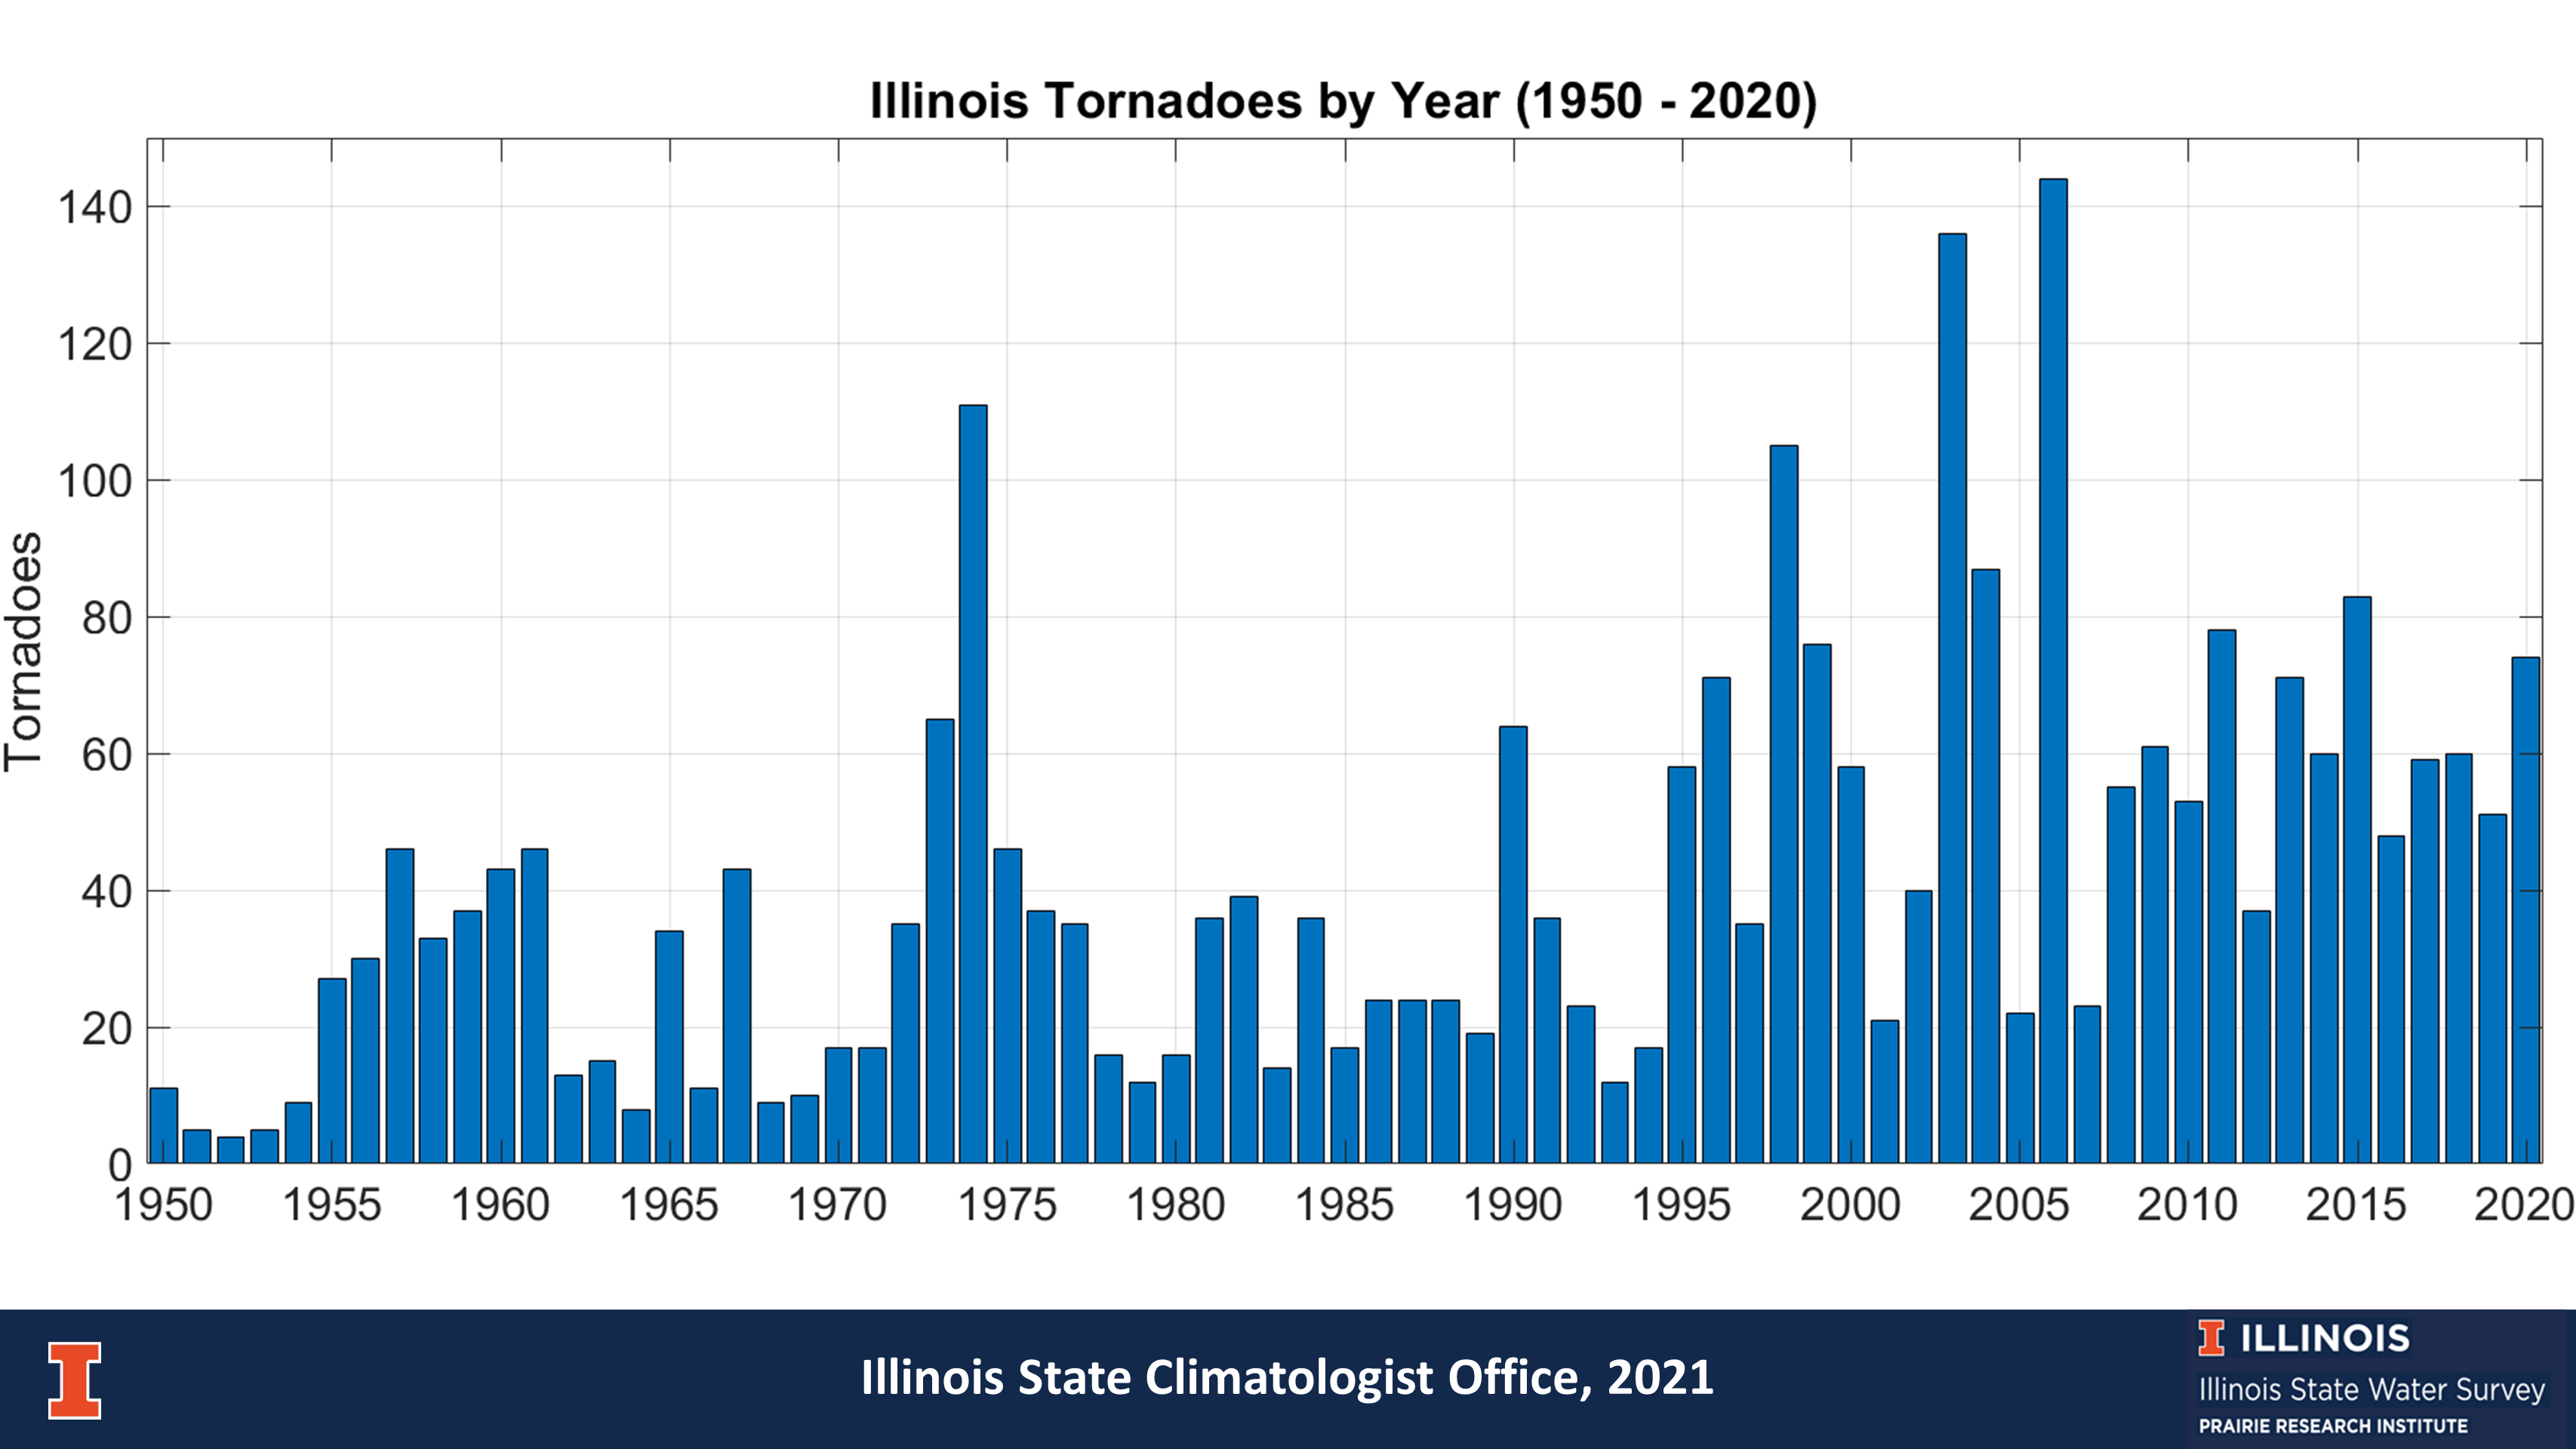
Figure 1. This plot shows the number of tornadoes per year from 1950 to 2020. The apparent upward trend over time is due largely to better tornado reporting since the mid 1990s due to better radar and spotter networks. This issue is discussed in more detail on the tornado trends page.
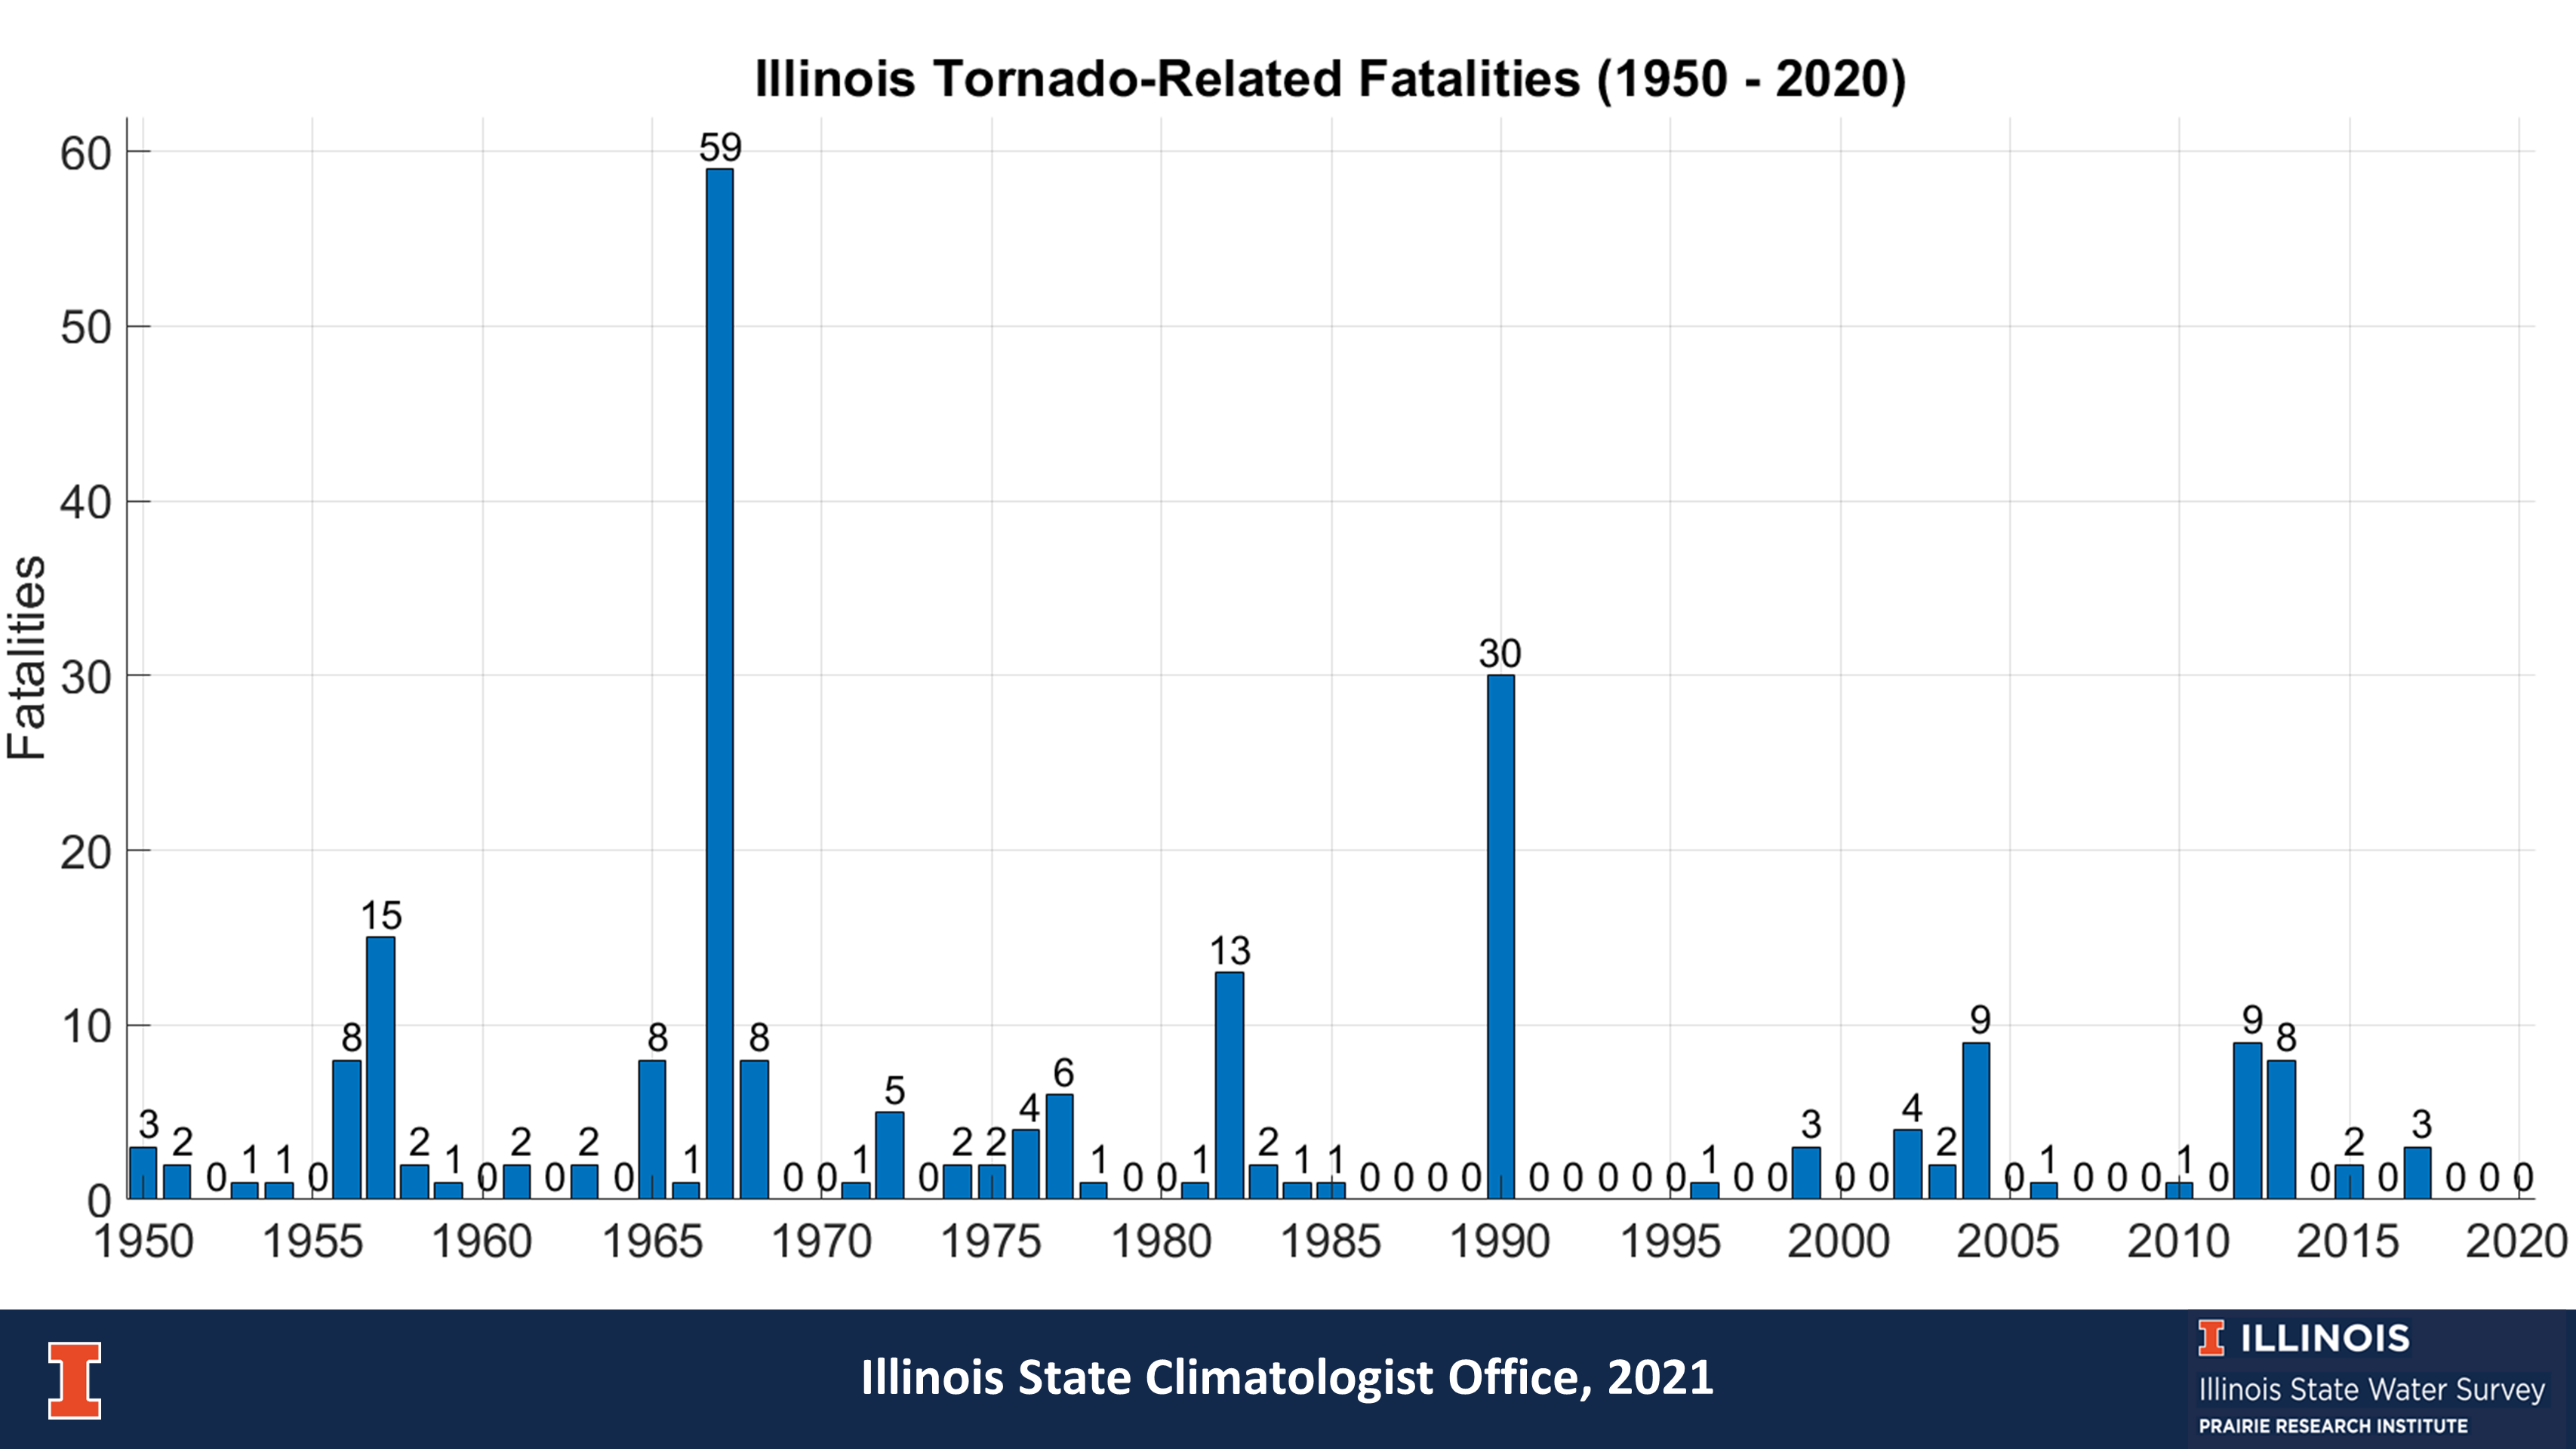
Figure 2. This plot shows the number of tornado-related fatalities from 1950 to 2020. The 1967 Belvidere and Oak Lawn event and the 1990 Plainfield event are the two standouts in the historical record.

Figure 3. This plot shows the number of tornado-related injuries from 1950 to 2020. On average, the number of injuries is 20 times higher than the fatalities from tornadoes.
Tornadoes, Fatalities, and Injuries by Month

Figure 4. This plot shows the number of tornadoes by month in Illinois. About 64 percent of all historical events occurred in April, May, and June. However, tornadoes can occur at any time in Illinois. Please take tornado watches and warnings seriously, regardless of the month.
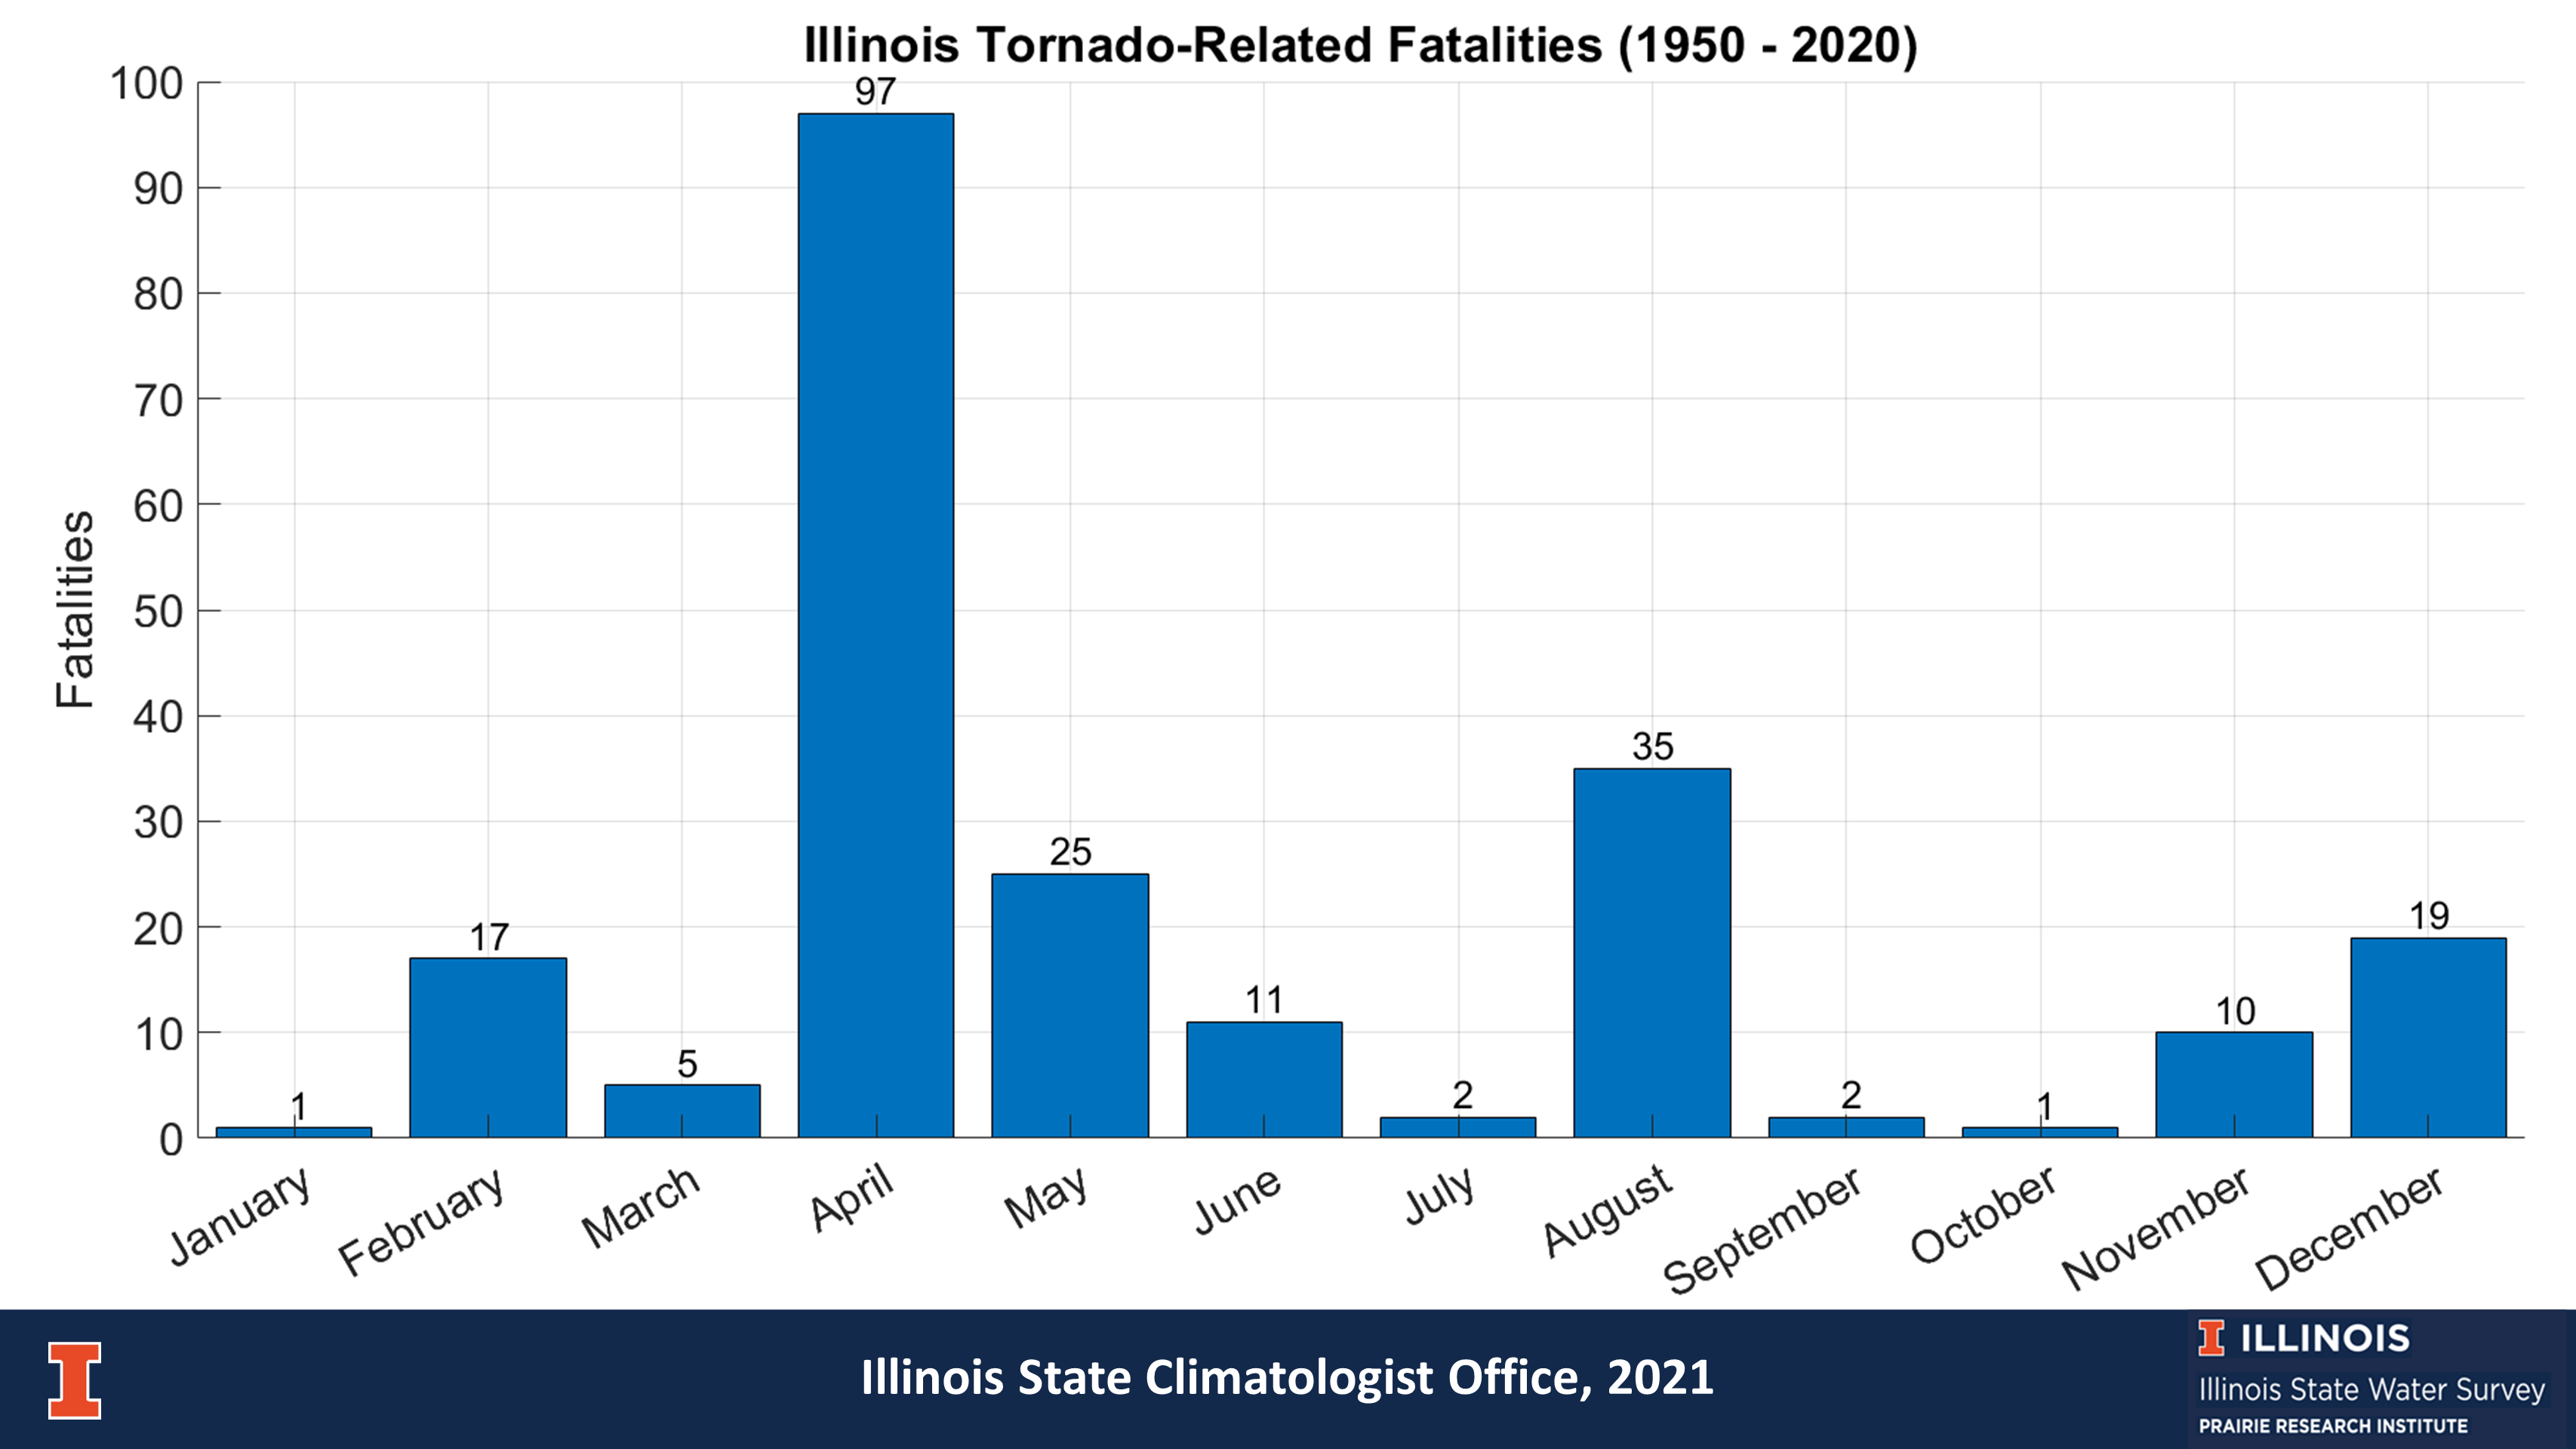
Figure 5. This plot shows the number of tornado-related fatalities by month for Illinois. April is the deadliest month with 97 reported deaths. The second deadliest month was August, mostly due to the 29 deaths associated with the August 28, 1990, Plainfield event. Importantly, December and February are the 4th and 5th deadliest months in Illinois despite have the 4th and 5th fewest tornadoes, respectively.
In fact, December and February together accounted for only 6% of all tornadoes, but 16% of all tornado-related fatalities between 1950 and 2020.

Figure 6. This plot shows the number of tornado-related injuries by month for Illinois. April is the worst month for injuries. April has a high frequency of tornadoes, deaths, and injuries. However, nearly 60% of all April tornado-related injuries and fatalities came from 1967 Oak Lawn tornado outbreak. Similarly, nearly 80% of all August tornado-related injuries and fatalities in Illinois came from the 1990 Plainfield tornado.
The number of deaths and injuries drop sharply in May and June even though the number of tornadoes is nearly as high as May and June. This may be due in part to better preparation and response to tornado watches and warnings as the season progresses, and longer daylight hours that reduce the chance of noctural tornadoes.
Tornadoes, Fatalities, and Injuries by Hour of the Day
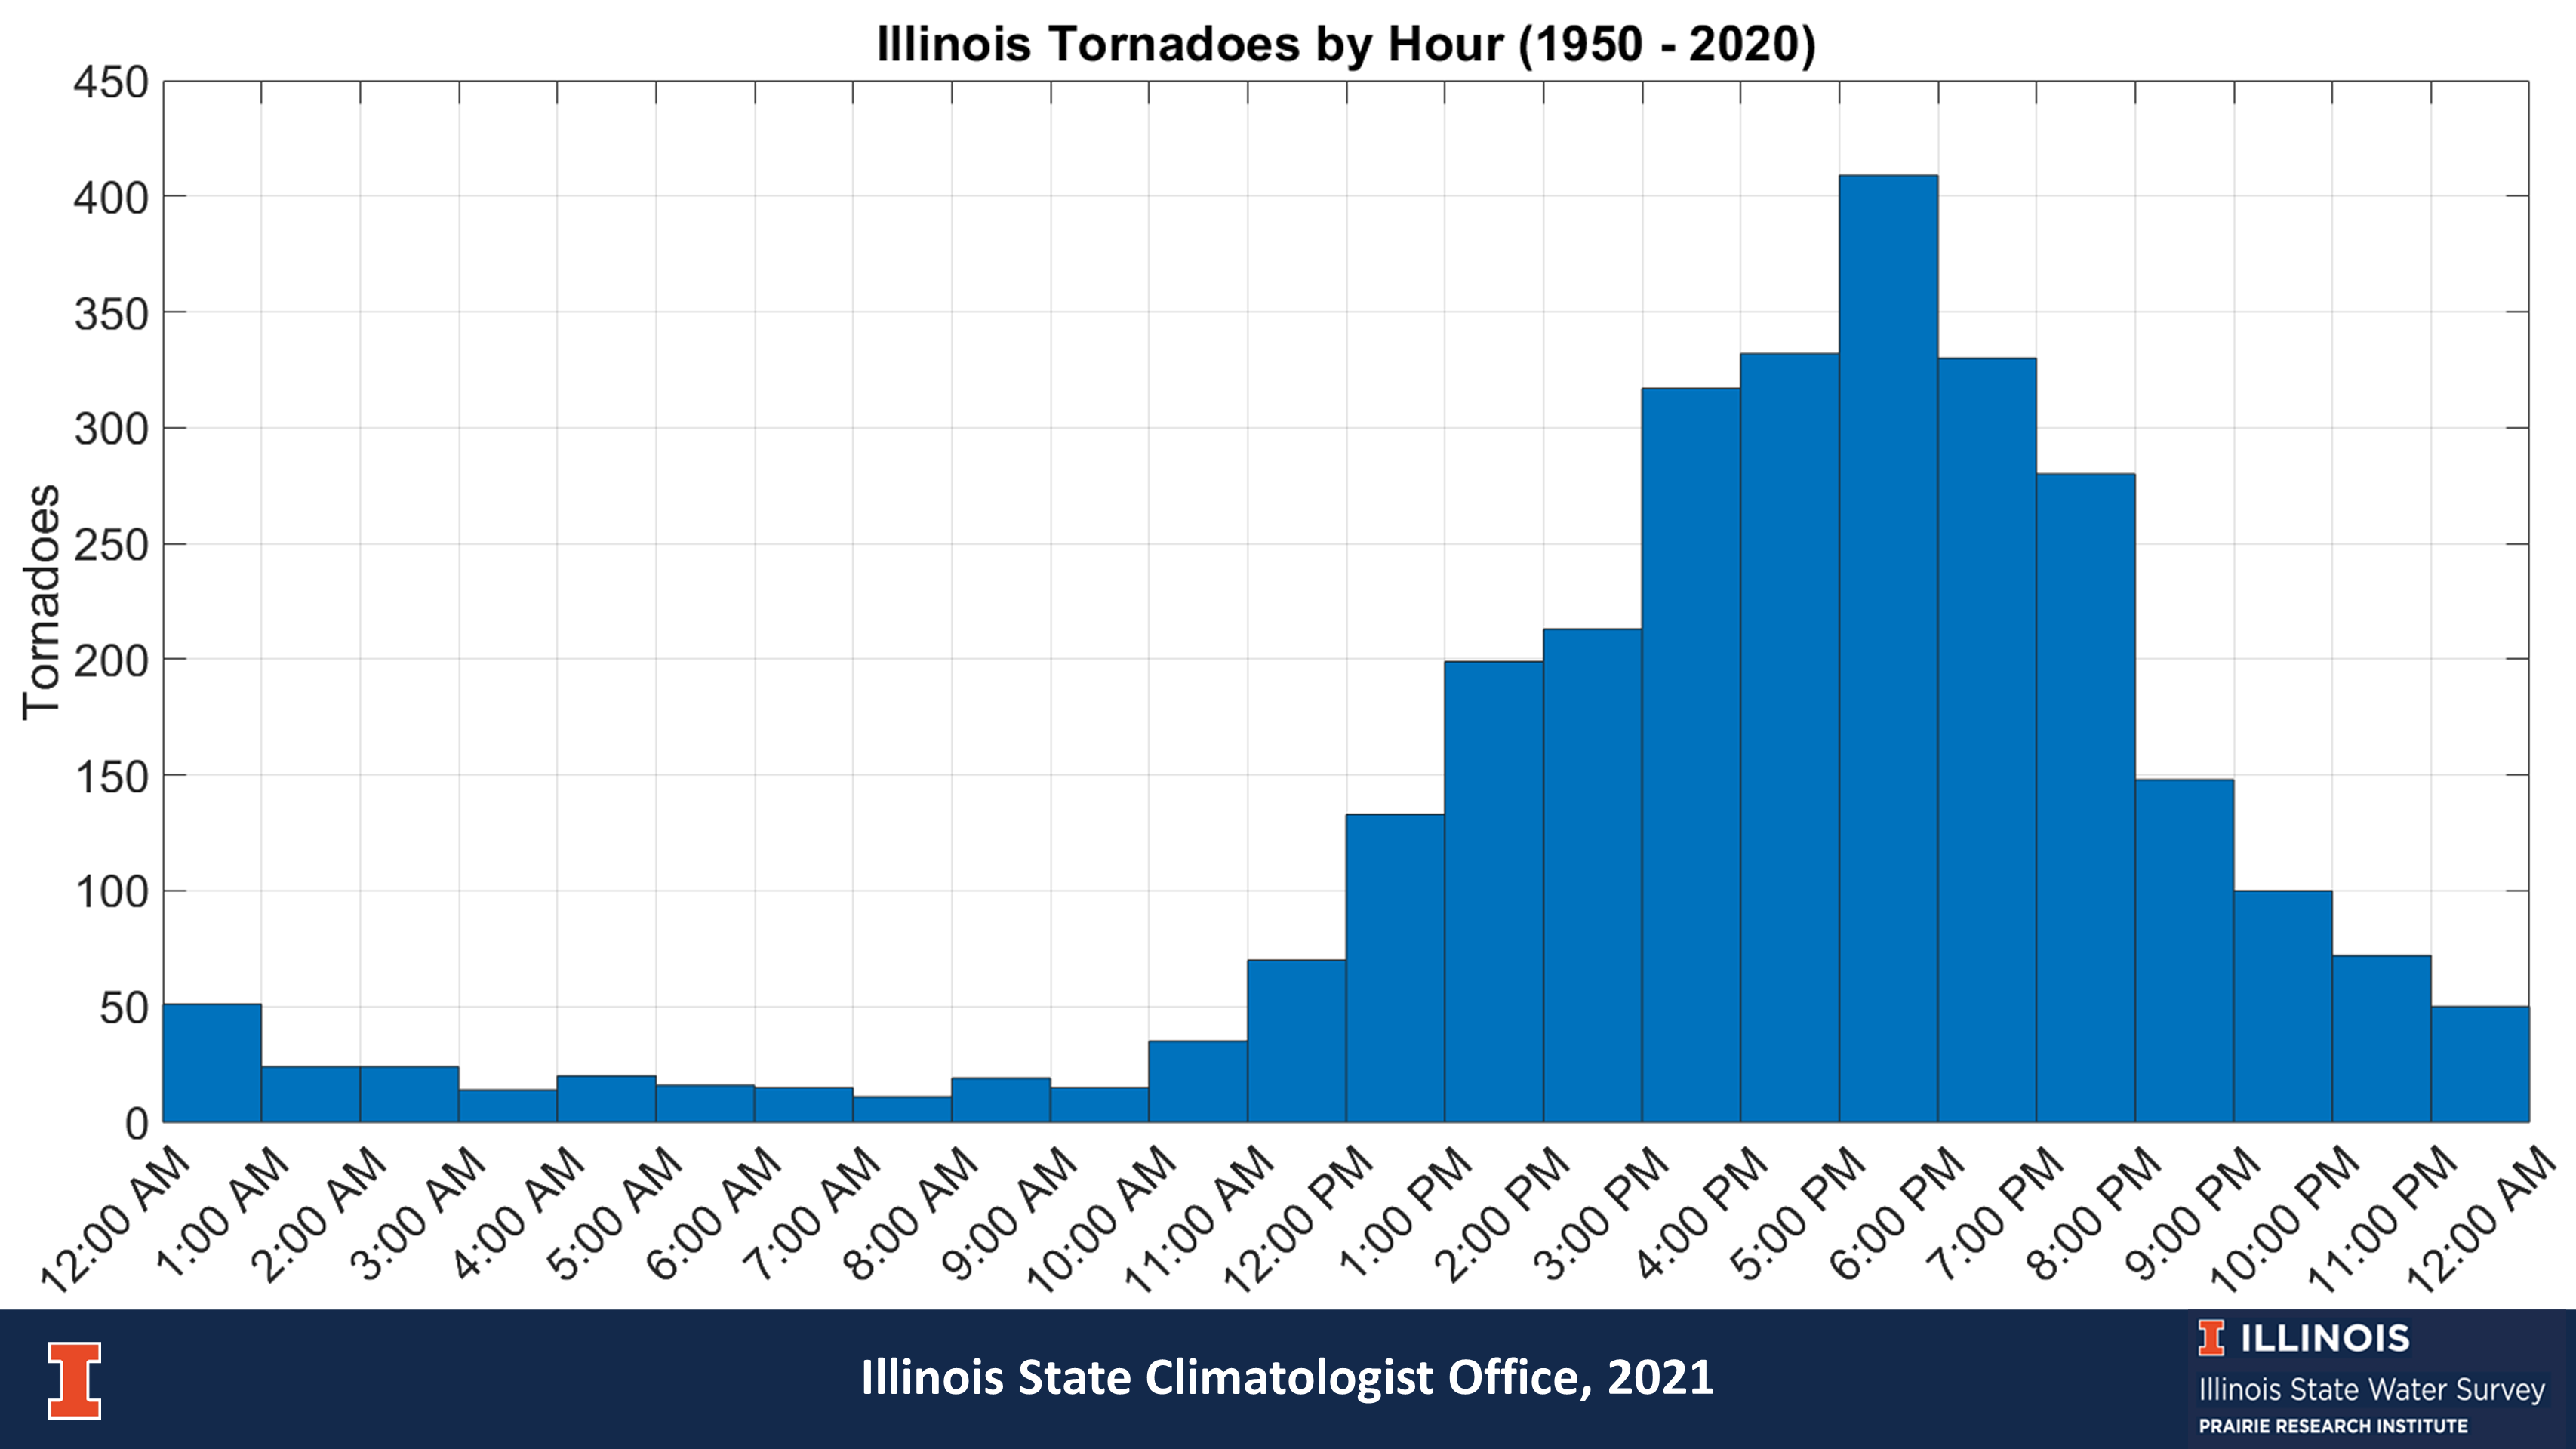
Figure 7. This plot shows the number of tornadoes by the time of day in Illinois. Tornadoes rarely occurred in Illinois between midnight and noon. However, the numbers rapidly increase each hour in the afternoon. They peak at 5 pm and decline through the rest of the evening. Nearly 60% of all tornadoes between 1950 and 2020 in Illinois occurred between 3 and 8 pm.
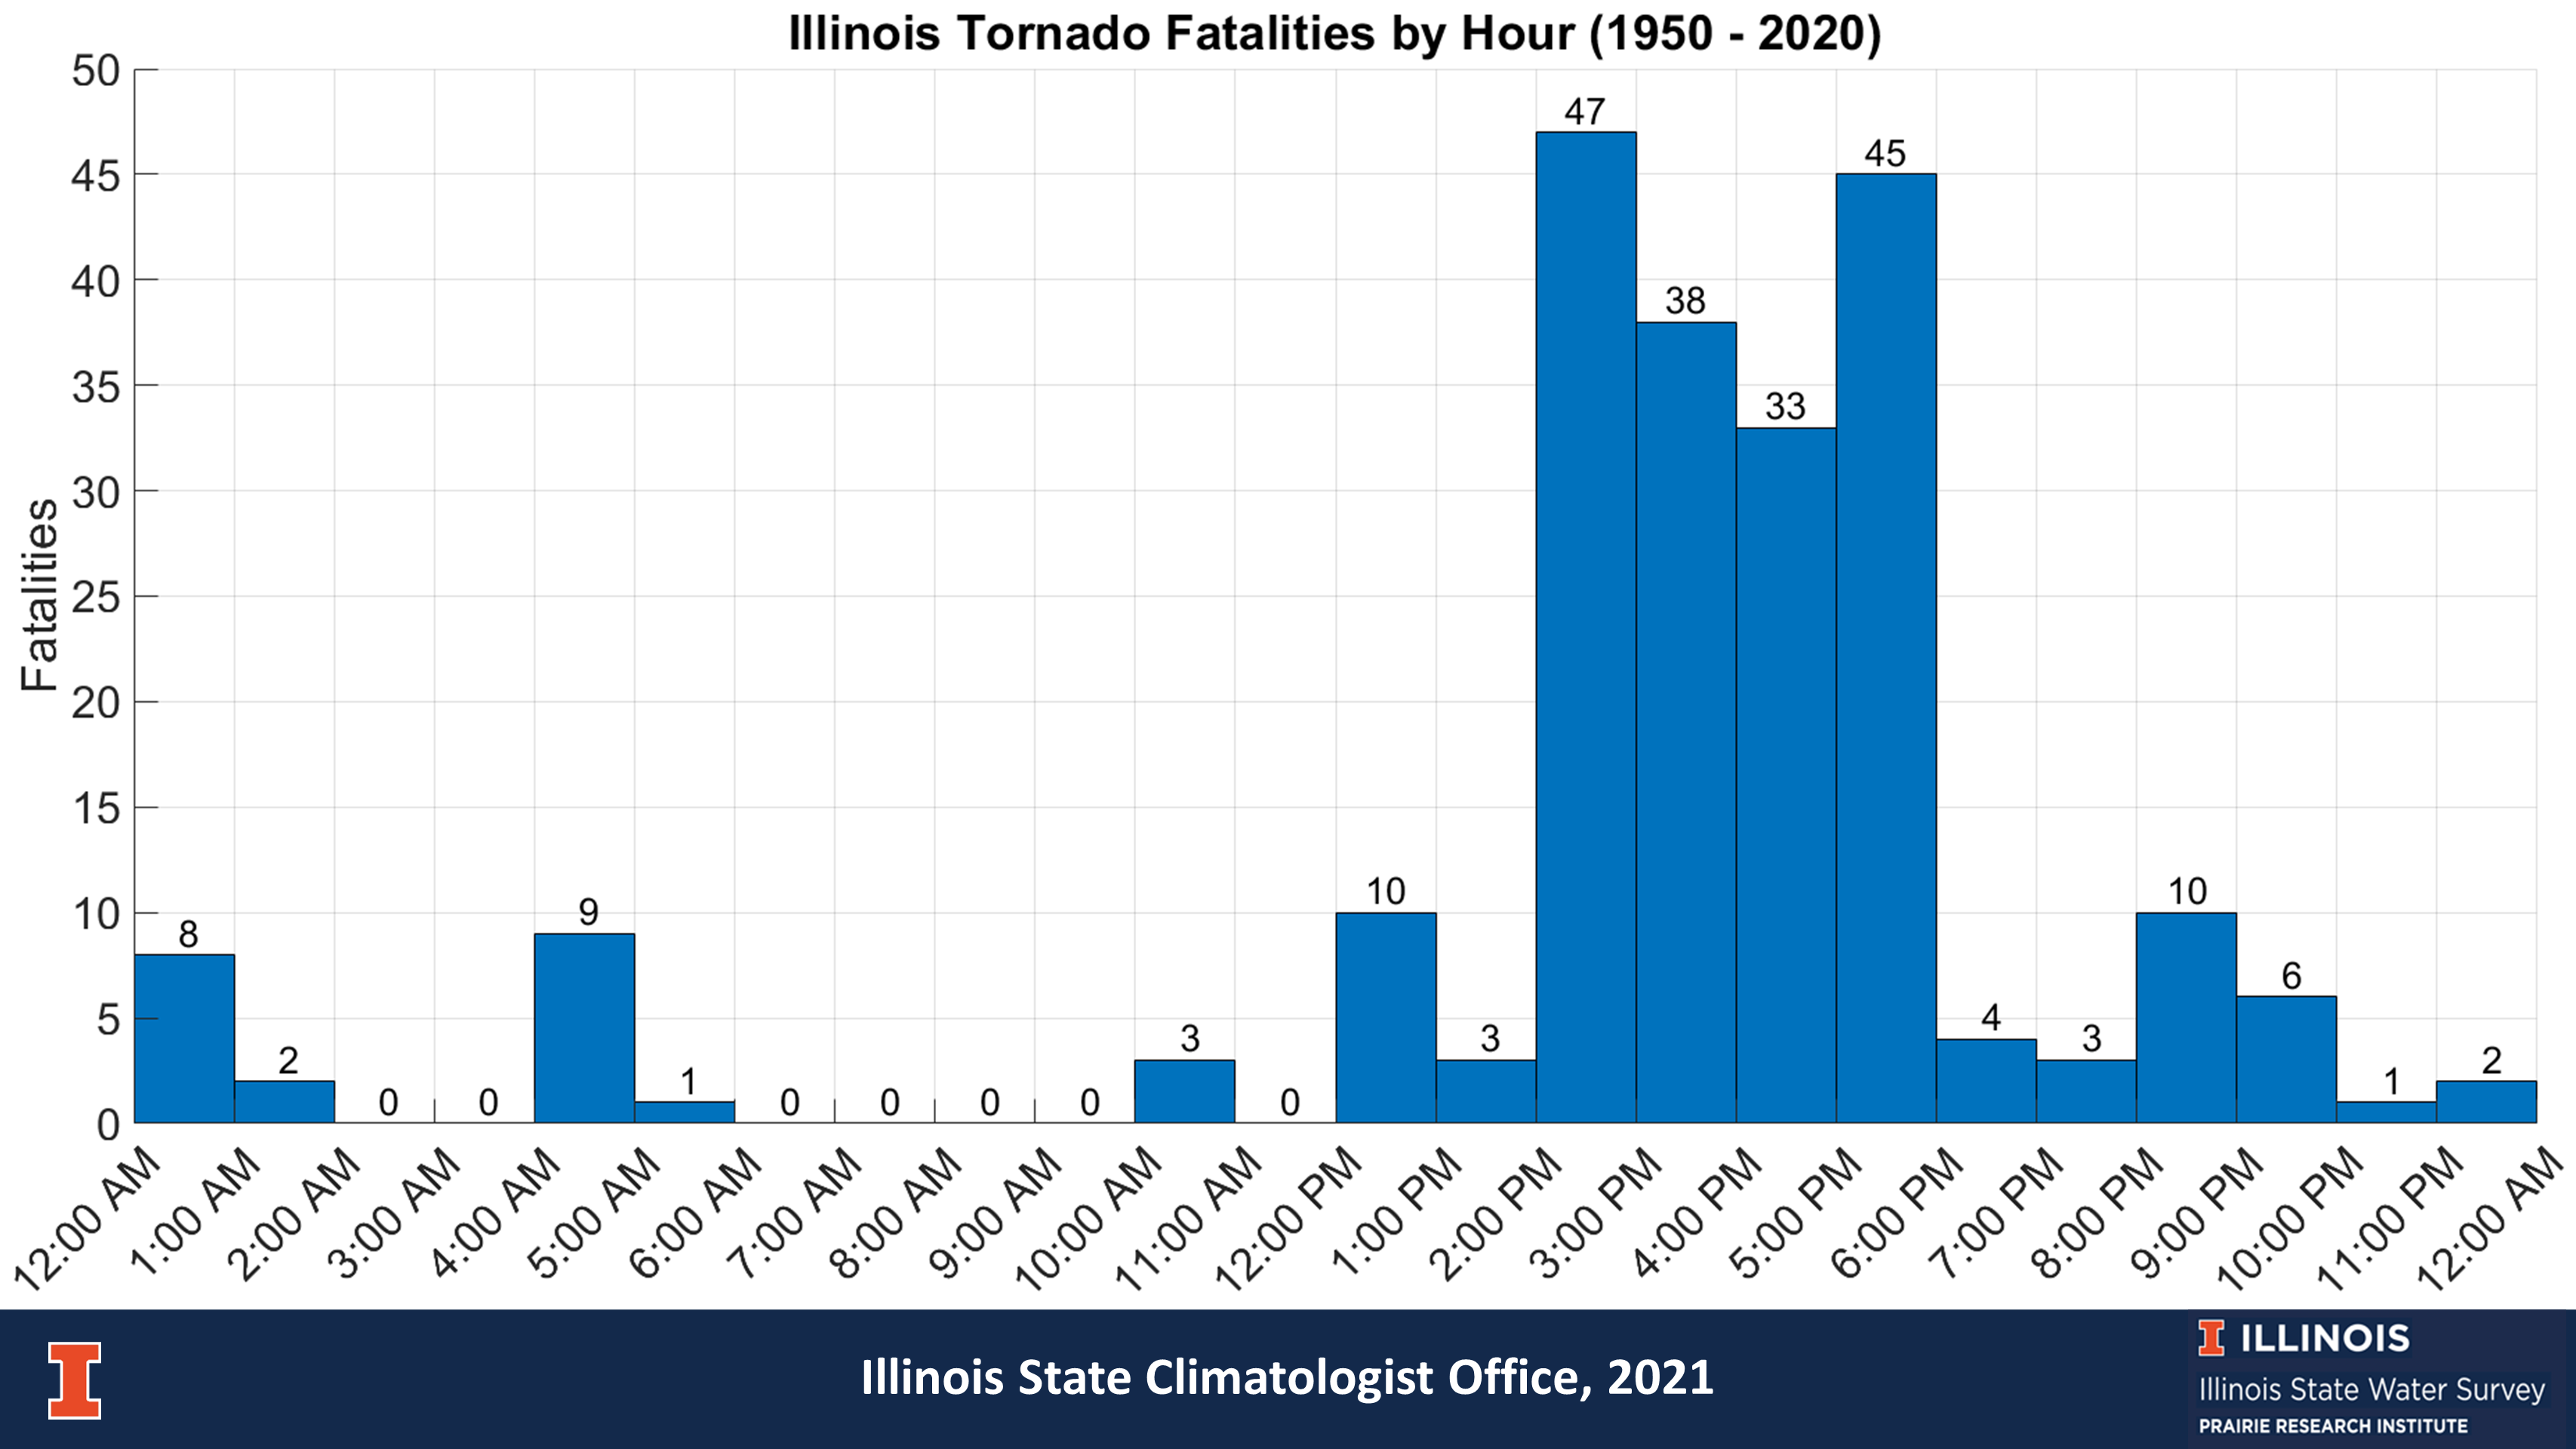
Figure 8. This plot shows the number of tornado-related fatalities by hour in Illinois. Most of the fatalities occurred between 2 and 5 pm.
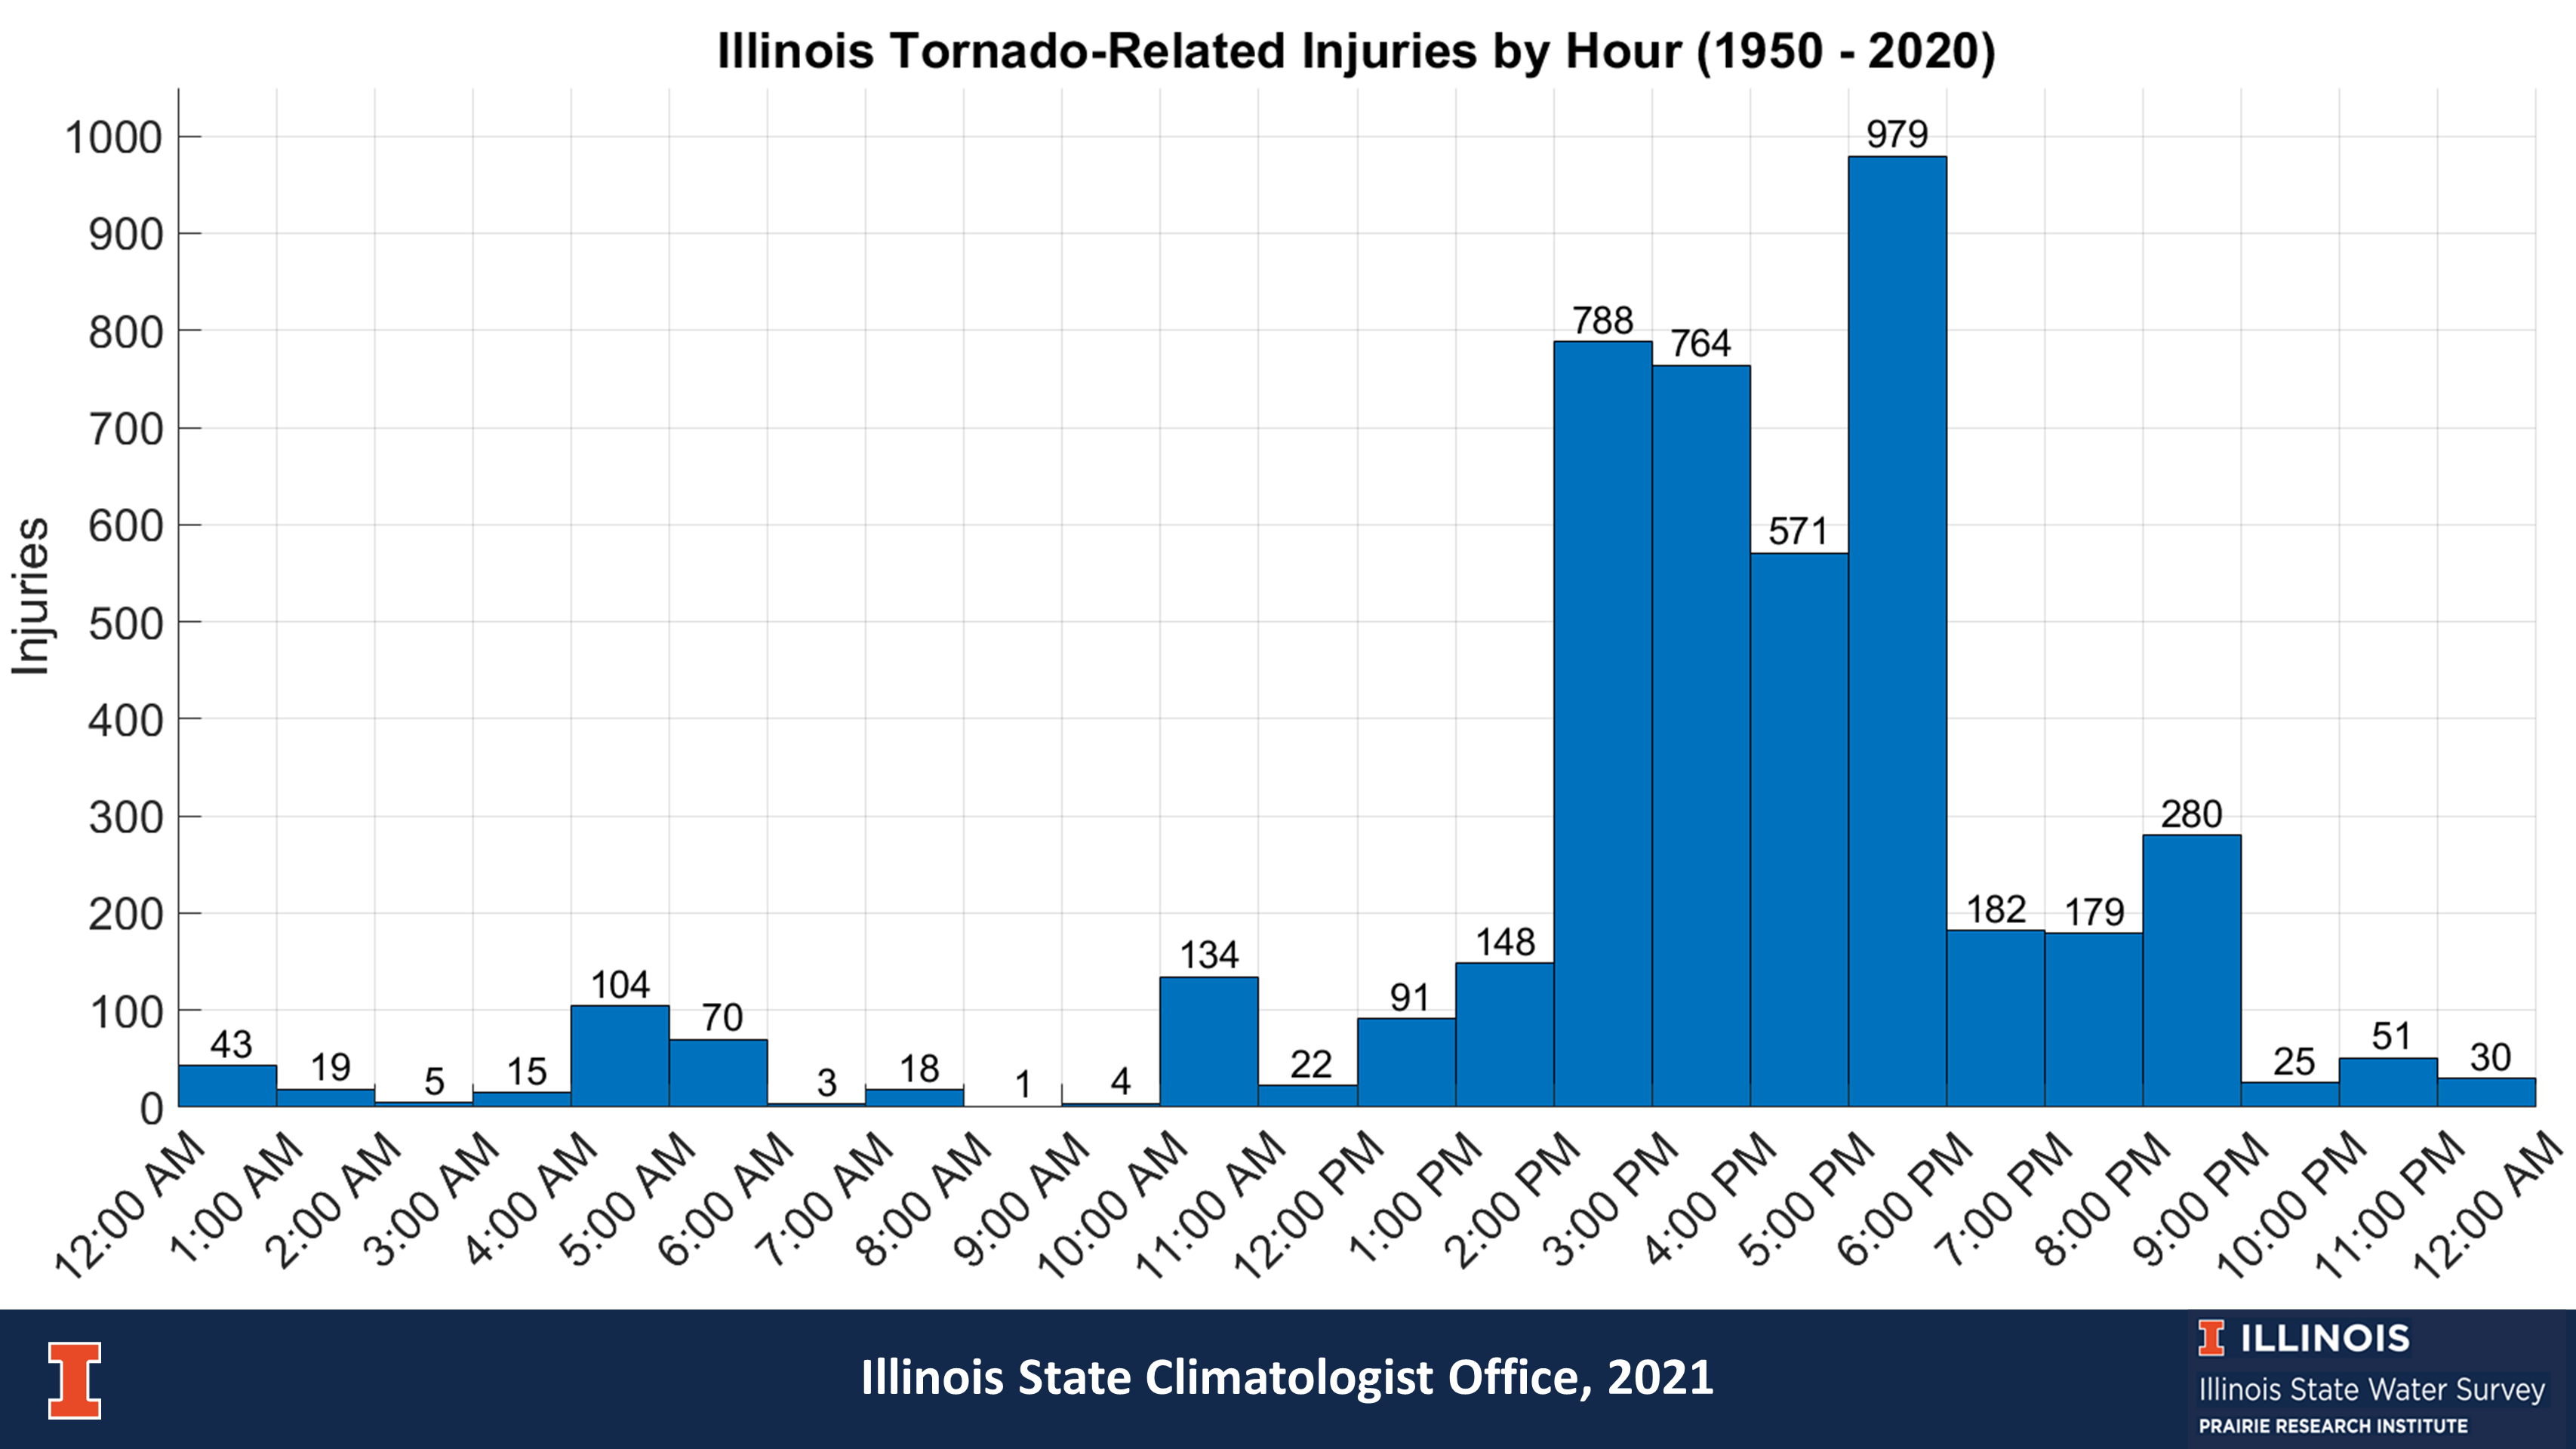
Figure 9. This plot shows the number of tornado-related injuries by hour in Illinois. Most of these occurred between 2 and 5 pm. The number of fatalities and injuries drop off sharply between 5 and 8 pm, but then increases between 8 and 9 pm.
Tornadoes, Fatalities, and Injuries by F-Scale
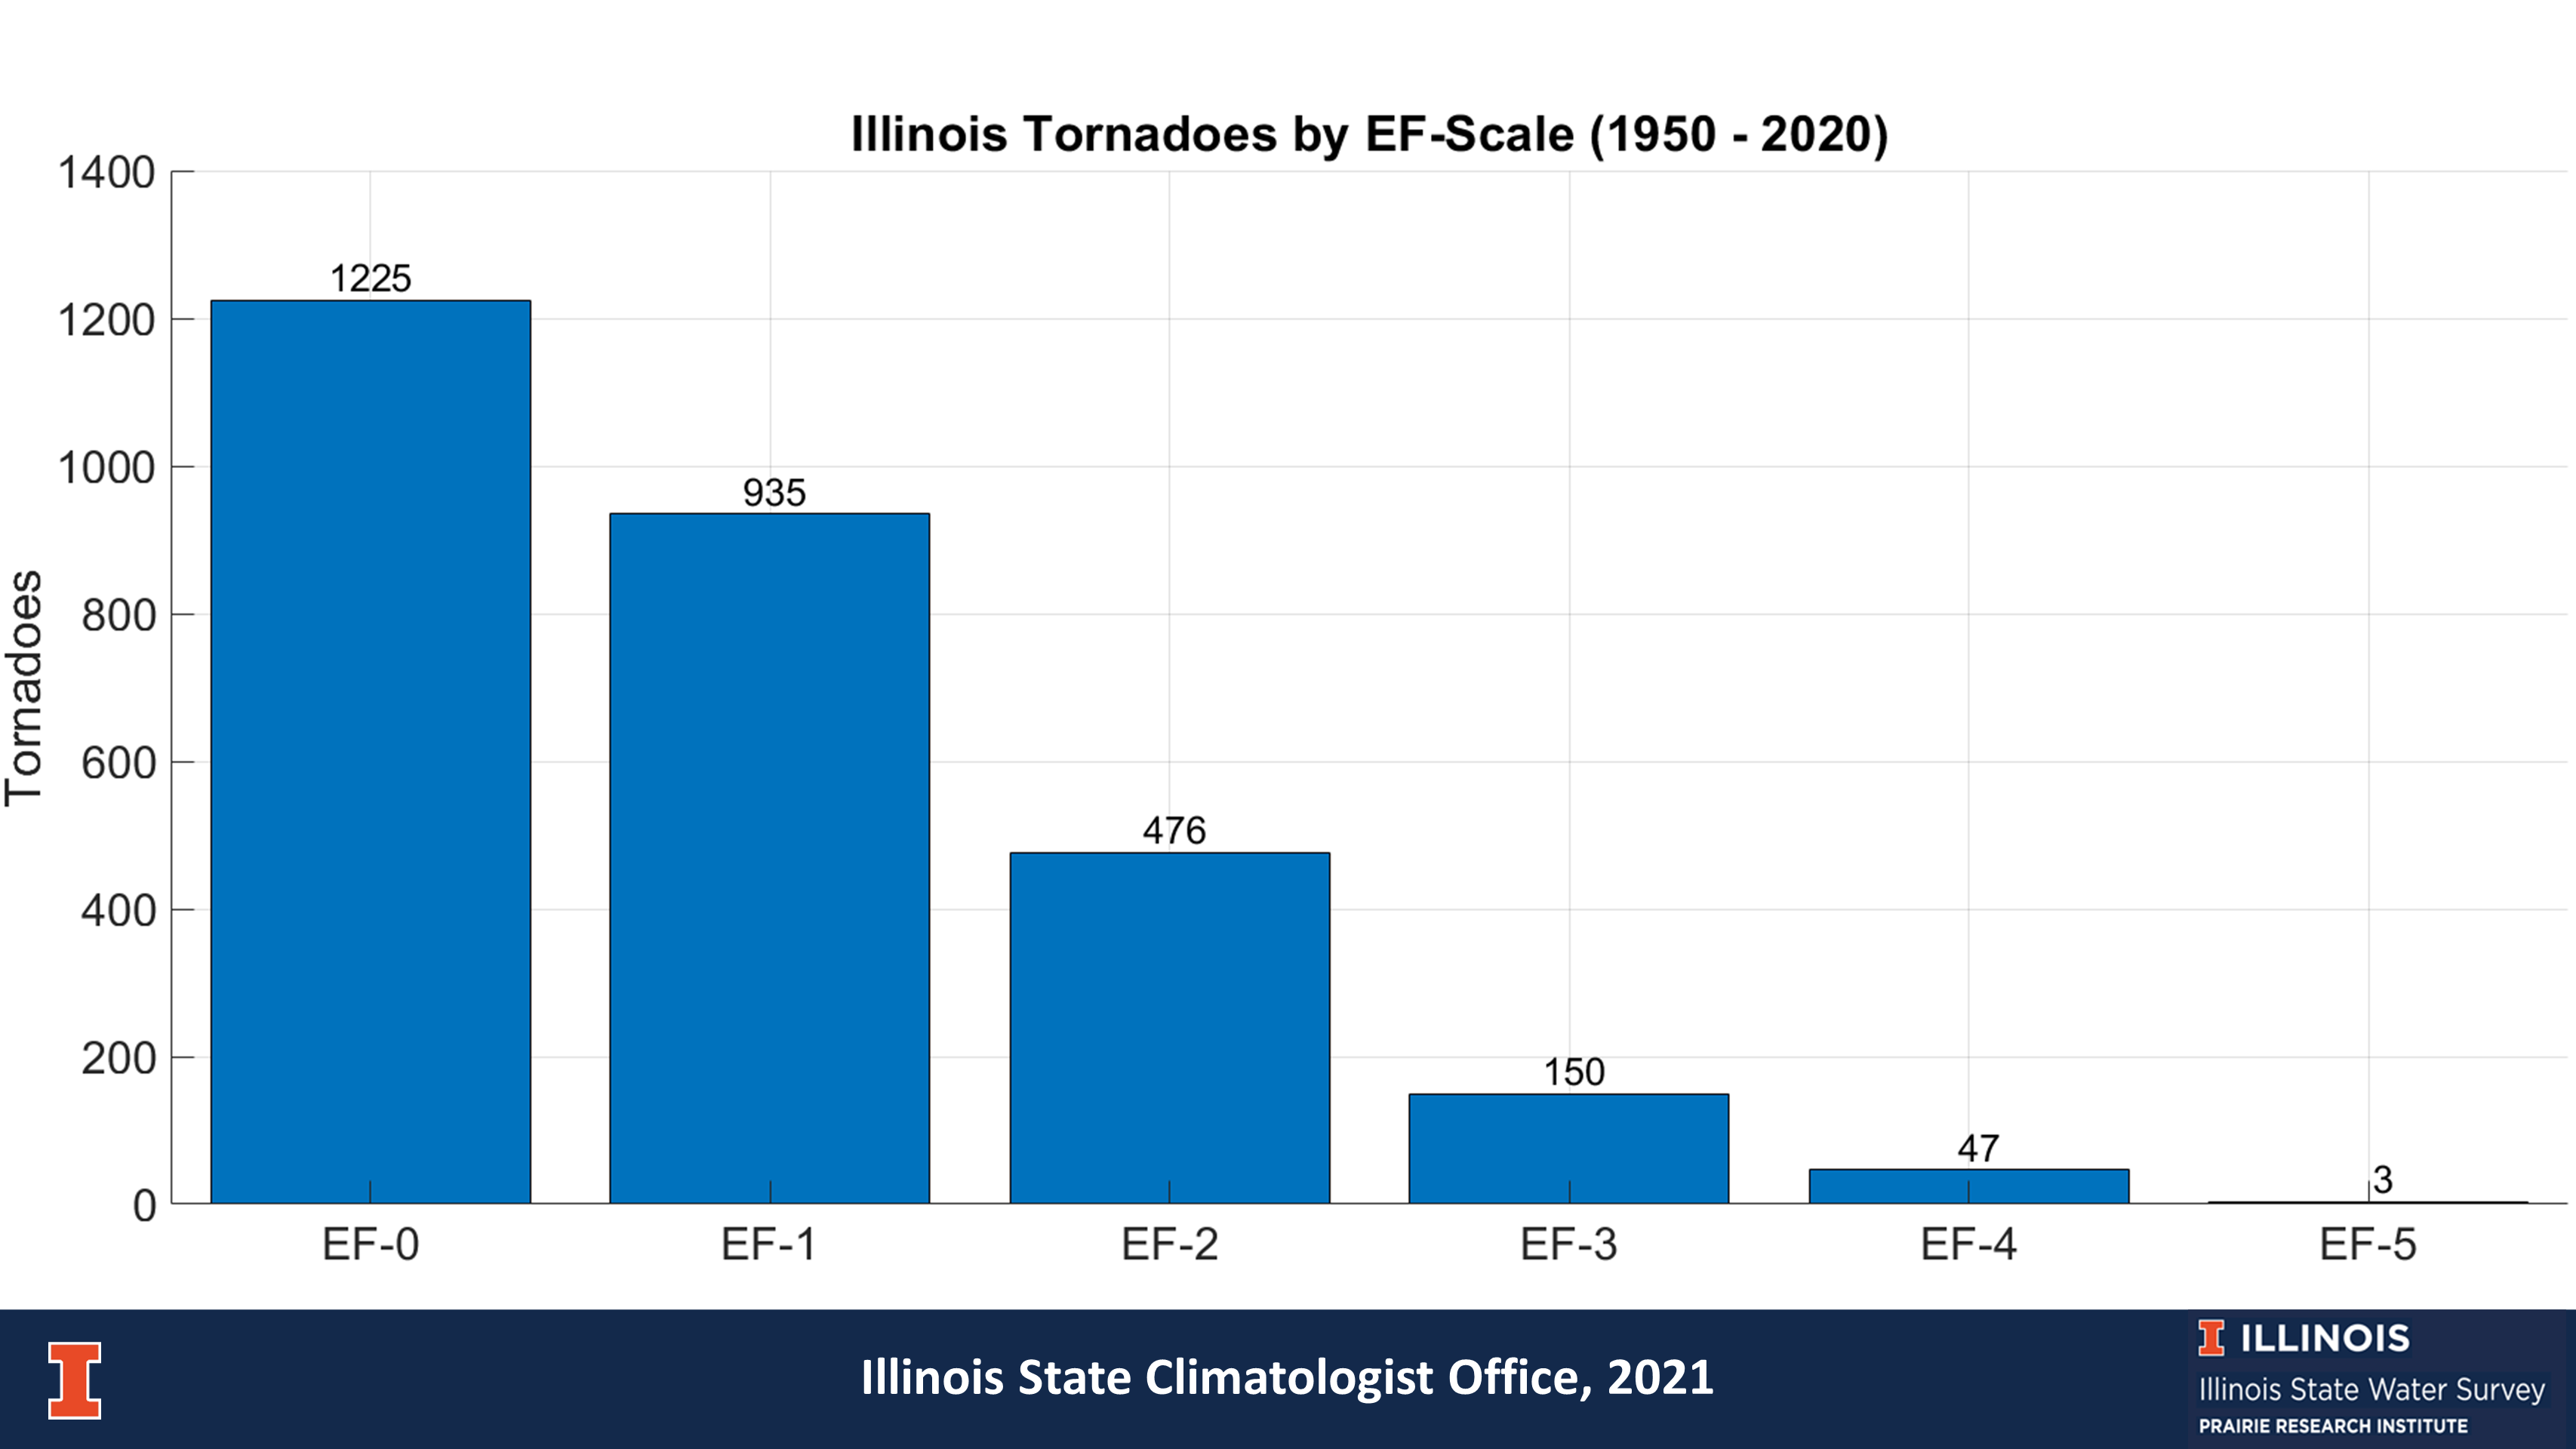
Figure 10. This plot shows the number of tornadoes in each category of the Fujita scale. The good news about tornadoes in Illinois is that the majority are at the weaker end of the Fujita scale. In fact, the most type of event, an “EF0”, tend to cause little if any damage and injuries or deaths are rare. The worst category of tornadoes, an “EF5”, are extremely rare. Only three have occurred in the records since 1950.

Figure 11. This plot shows the total number of fatalities (left) and the number of fatalities per tornado event (right) in each category of the Enhanced Fujita scale. Both total deaths and deaths per tornado event increase with tornado intensity. The 3 EF-5 tornadoes that occurred in Illinois between 1950 and 2020 have an average rate of 10 deaths per event, compared to fewer than 1 death per event for EF-3 and weaker tornadoes.
However, because EF-3 tornadoes occur much more frequently than EF-5s, the former are responsible for 20 more deaths than the latter since 1950.
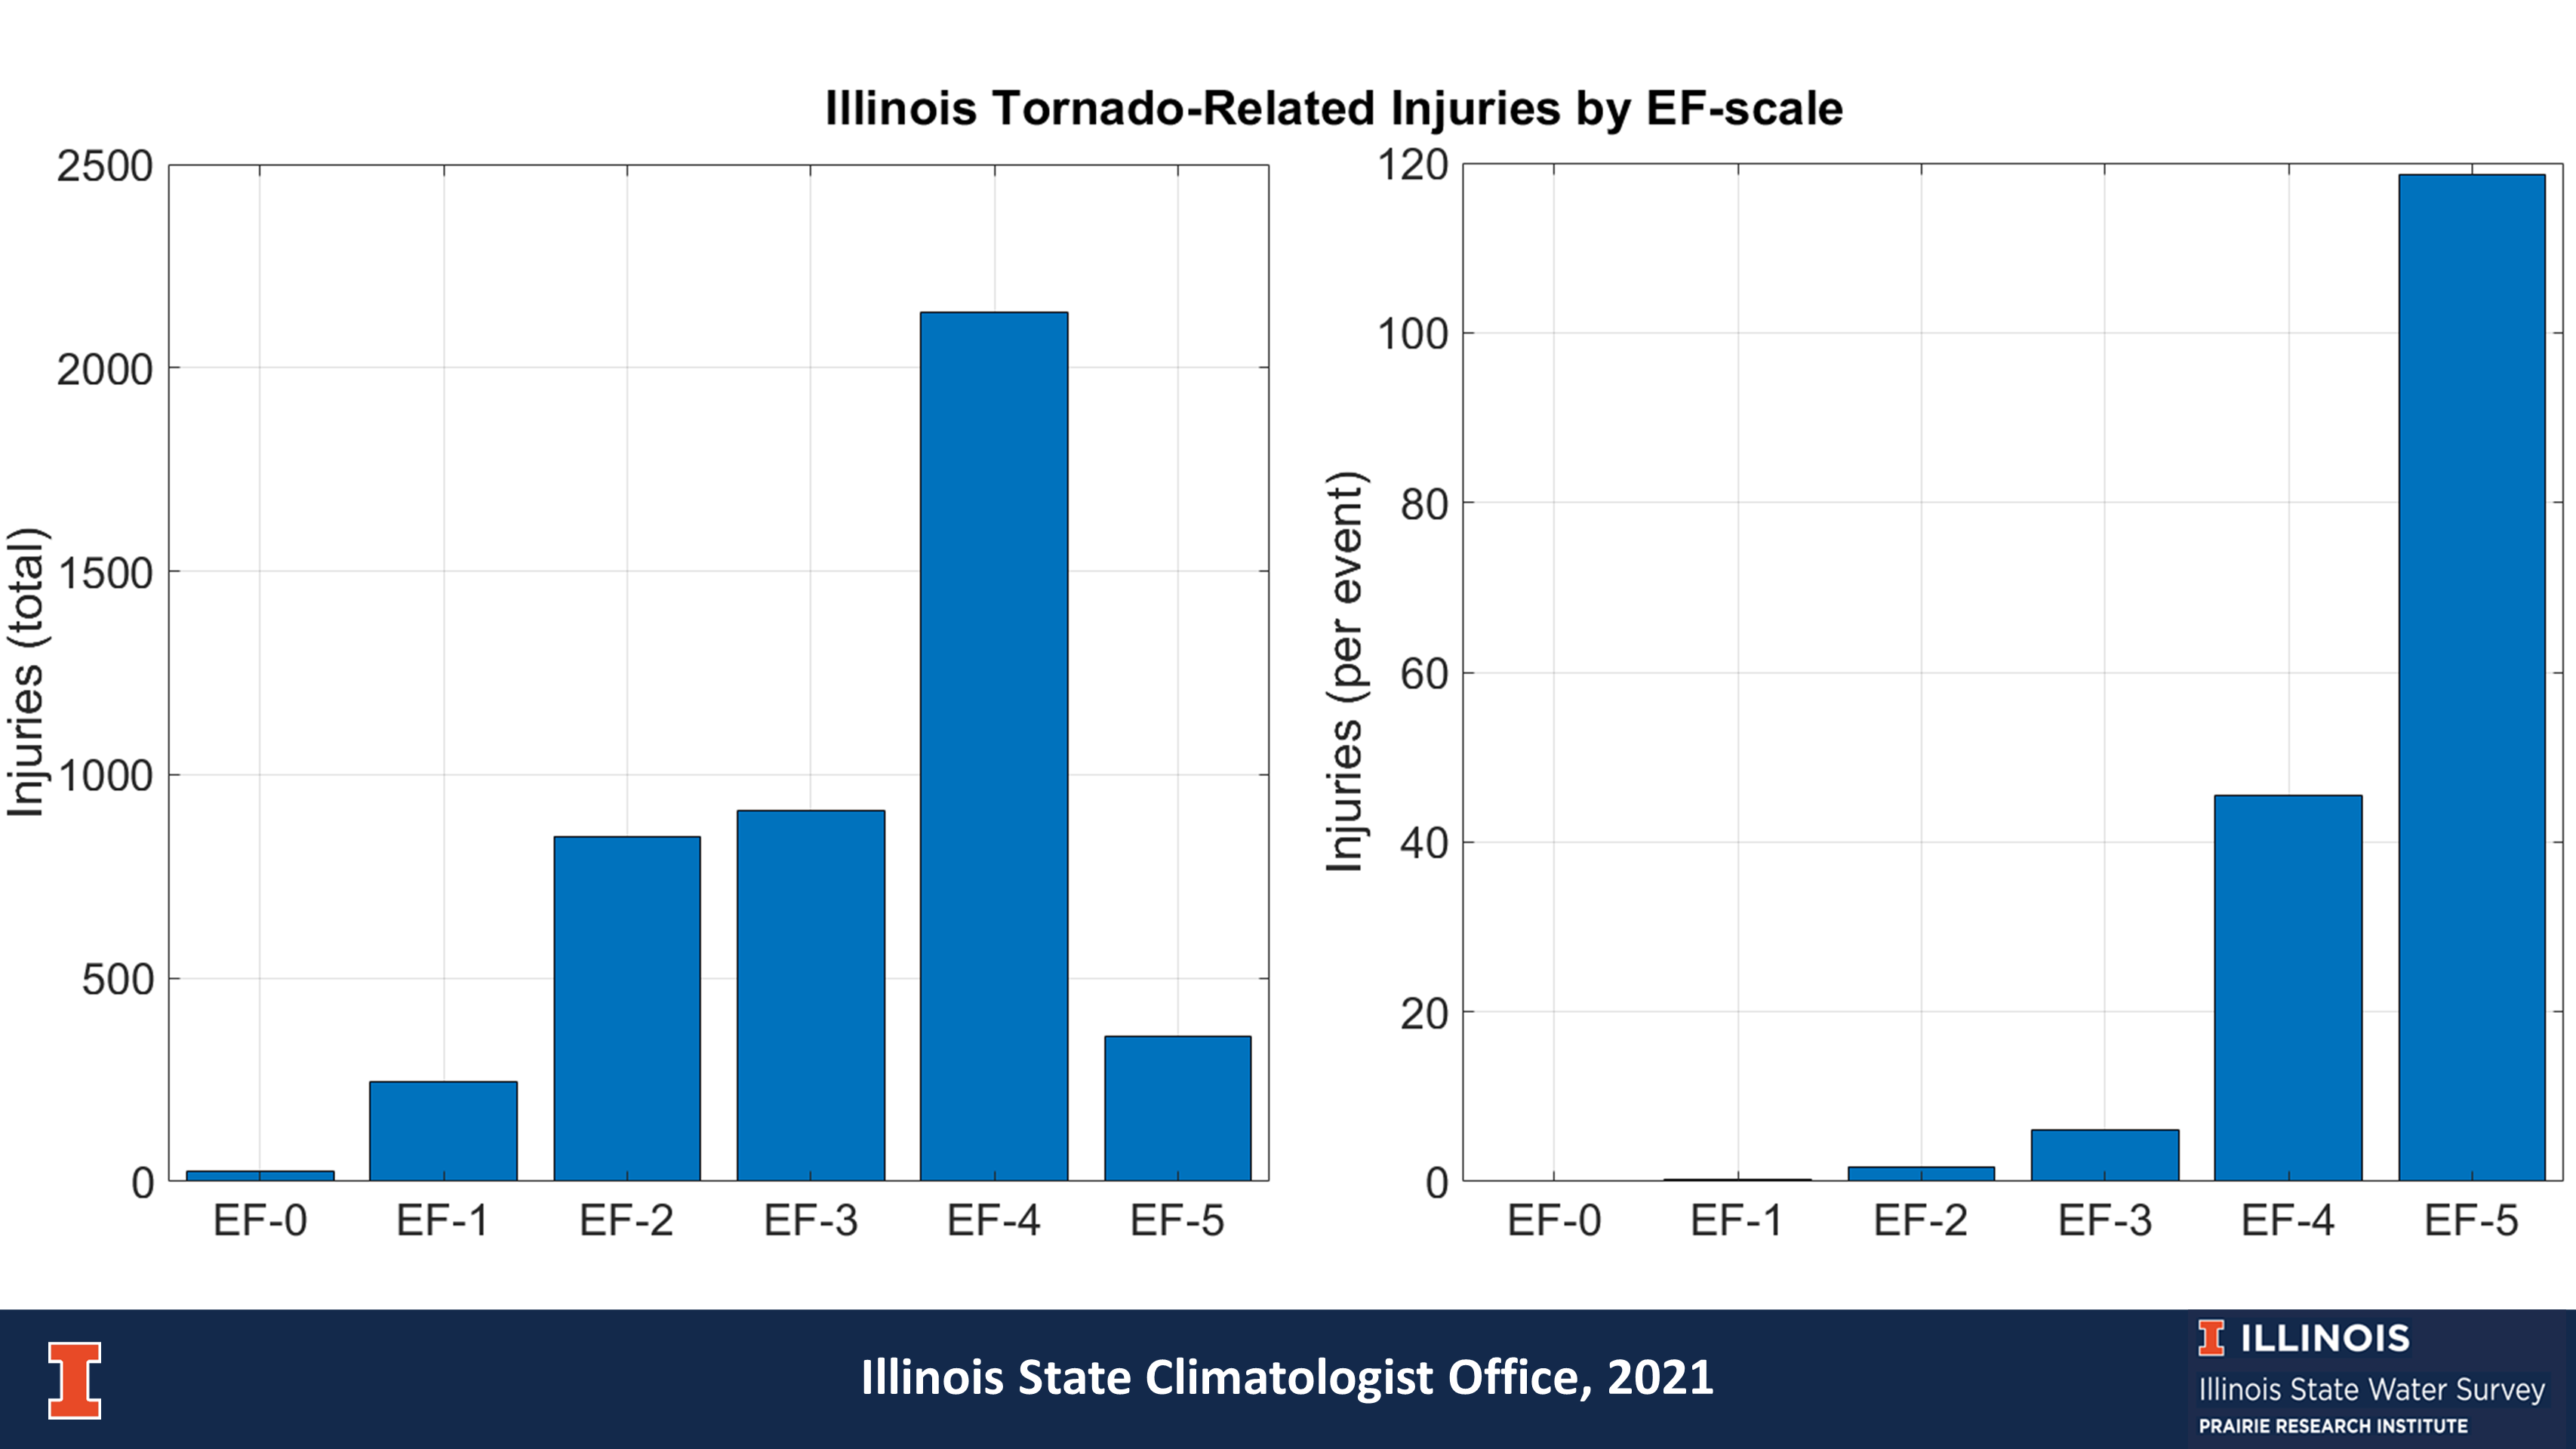
Figure 12. This plot shows the total number of injuries (left) and the number of injuries per tornado event (right) in each category of the Enhanced Fujita scale. Both total injuries and injuries per tornado event increase with tornado intensity. The 3 EF-5 tornadoes that occurred in Illinois between 1950 and 2020 have an average rate of 118 injuries per event, compared to fewer than 10 injuries per event for EF-3 and weaker tornadoes.
Similar to deaths, though, because EF-3 tornadoes occur much more frequently than EF-5s, the former are responsible for nearly 600 more injuries than the latter since 1950.
Tornado Trends
Tornado Trends in Illinois
Here is an example of how the method for collecting data changes over time, causing a signal that looks like climate change. The first figure shows the annual number of tornadoes per year in Illinois since 1950, regardless of strength. Beginning in the 1990s, the number of tornadoes has increased dramatically with wider variations from year to year.
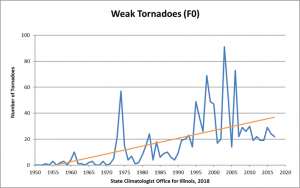
The second figure shows the upward trend in the number of the weakest F0 (EF0) tornadoes. These rarely cause any damage and traditionally were ignored. The upward trend in recent years is the result of better radar systems, better spotter networks, and increased awareness and interest by the public. Combined these factors have allowed for a better documentation of the weaker events over time.
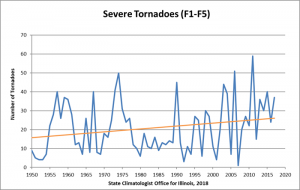
The third figure shows a much weaker trend in the stronger tornado events – those classified as F1 to F5 in the original Fujita Scale, and EF1 to EF5 in the Enhanced Fujita Scale. These represent the tornadoes that cause at least moderate damage, are well documented, and perhaps less sensitive to data collection methods.