There is a 95% chance that El Niño will continue through winter and gradually weaken through spring 2016, according to the NOAA Climate Prediction Center today. That remains essentially unchanged from last month’s outlook. As noted in a earlier post, this increases the chances of a mild winter in Illinois.
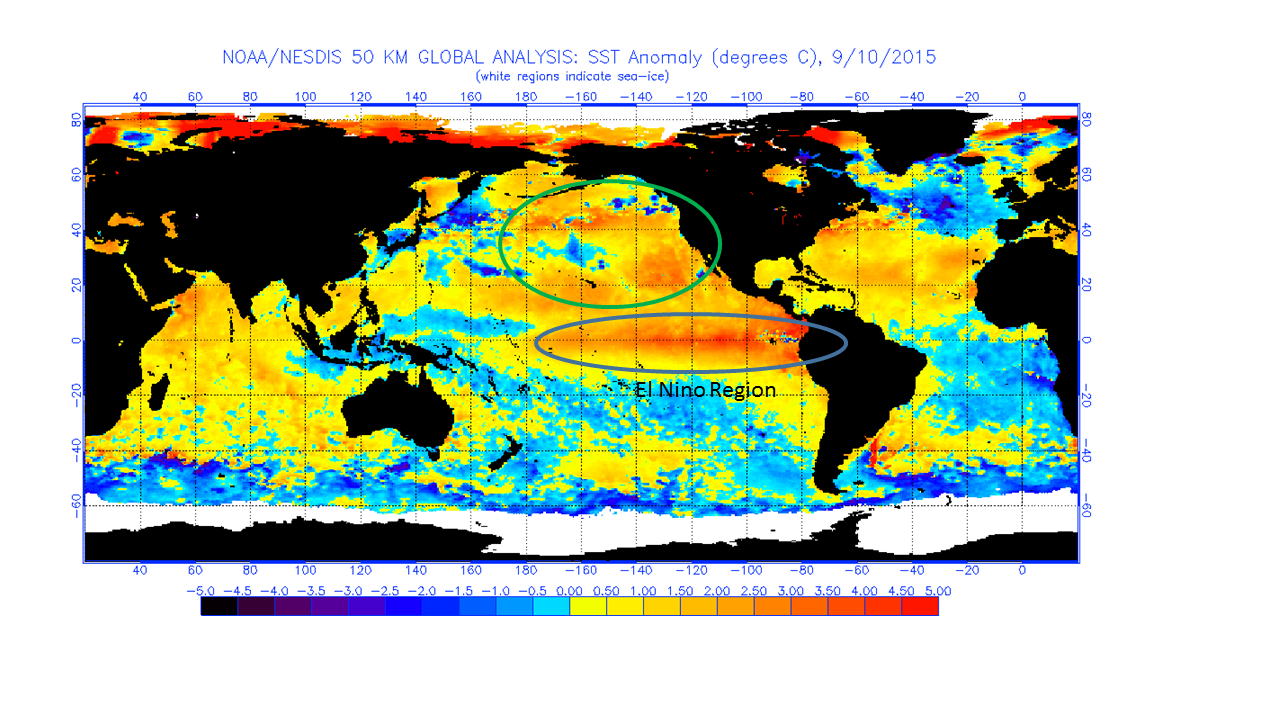
Here are the recent sea surface temperatures, as a departure from the average, in the Pacific Ocean basin. The units are in degrees Celsius, so just double the number to get the approximate departure in degrees Fahrenheit. This represents an impressive amount of heat, considering that these warmer water temperatures cover thousands of square miles.
The traditional area for El Niño formation is circled and labeled on the map. The one wild card in the current situation is that we have exceptionally warm waters farther to the north than what I have seen in past El Niño episodes (green circle). This could potentially change the impacts of El Niño over North America.
Click to enlarge. Source NOAA http://www.ospo.noaa.gov/Products/ocean/sst/anomaly/
Today the NOAA Climate Prediction Center released their latest winter forecast. First, there are two important notes about the winter forecast. One is that El Niño has not arrived yet, and if it does, it is expected to be mild.
The other point is that the current conditions are not always a reliable predictor of future conditions. In other words, just because we are having a cold November (9 degrees below average), that does not doom us to another cold winter. To give a recent example, November of 2012 was 1.3 degrees below average, while the following winter of 2012-13 was 3.0 degrees above average.
The first panel shows the temperature odds for December-February, our core winter months. Southern Illinois has a slightly elevated chance of colder-than-average temperatures as does most of the southern states. There is a stronger chance that temperatures will be above-average on the West Coast and Alaska.
The second panel shows the precipitation odds for winter. The outstanding feature for us is the large area around the Great Lakes with an increased chance of being drier-than-average that covers all of Illinois.
Probably the most frequently asked question I get these days is “Will this winter be as bad as last winter?” I discussed this a bit in an earlier post. The National Weather Service forecast does not show a repeat of last winter based in part on winter trends and the possible arrival of El Niño.
Another way to look at this is through the historical data. I looked at the 20 coldest winters for Illinois since 1895 and what the next winter was like (table below). “Temp” is short for temperature and “depart” is short for temperature departure from average.
Since this last winter was #9, that leaves us with 19 other winters where we can look at the next year. Of those 10 of the following winters were below average. In fact, we see the three-peat winters of 1976-77, 1977-78, and 1978-79 in the line up as well as the repeat winters of 1903-04, and 1904-05.
Or if you are an optimist, 9 of the following winters were at or above average. If you look at the plot below the table, you can see that with the exception of the late 1970s and the early 1900 episodes, our colder winters have been followed by a winter more moderate – maybe not warm but at least not as cold. Also we have seen a warming trend of about 1ºF in the historical record. For the record, I’m hoping for a milder winter.
Top 20 coldest winters (December-February) and the following winters.
Rank
Winter
Depart
Next Winter
Depart
1
1977-78
-9.5
1978-79
-9.3
2
1978-79
-9.3
1979-80
-1.4
3
1935-36
-9.0
1936-37
+0.1
4
1917-18
-8.8
1918-19
+3.7
5
1976-77
-8.3
1977-78
-9.5
6
1903-04
-7.9
1904-05
-7.4
7
1962-63
-7.6
1963-64
-3.2
8
1904-05
-7.6
1905-06
+0.4
9
2013-14
-7.4
2014-15
??
10
1911-12
-6.3
1912-13
0
11
1981-82
-6.2
1982-83
+4.6
12
1898-99
-6.1
1899-00
-2.5
13
1901-02
-6.0
1902-03
-2.9
14
1909-10
-5.7
1910-11
+0.1
15
1919-20
-5.3
1920-21
+3.9
16
1969-70
-4.7
1970-71
-1.3
17
1958-59
-4.4
1959-60
+1.0
18
1928-29
-4.3
1929-30
-0.1
19
2000-01
-4.3
2001-02
+5.6
20
1983-84
-3.9
1984-85
-2.9
Statewide average winter temperature for Illinois. Source: National Climatic Data Center.