The statewide precipitation for June is 6.6 inches, 2.5 inches above the 1971-2000 average (normal). That makes it the ninth wettest June on record (based on preliminary numbers as of June 28, 2011).
The statewide precipitation for the first six months of 2011 is 27.2 inches, 7.7 inches above the 1971-2000 average. That makes it the fourth wettest January-June on record. Statewide records go back to 1895.
The figure below shows the June departure from normal precipitation across the US. Cool coolers (green, blue, purple) show abnormally wet conditions. Warm colors show abnormally dry conditions. Wet conditions have prevailed from Montana, into the Dakotas, Nebraska, Iowa, northeastern Missouri, across Illinois, and much of the lower Ohio River valley. However, dry conditions are not far from Illinois borders, especially to our southwest.

The figure below shows the year-to-date departure from normal precipitation across the US. Like June, the band of above-normal precipitation extends from Montana, down the Missouri River, and up the Ohio River valleys. This area has seen abundant atmospheric moisture and a strong, persistent jet stream for much of winter and spring. Meanwhile, the Southwest and South have struggled with dry conditions. BTW, it is not unusual to have one part of the US experiencing drought while another part experiences heavy rains and flooding. It is amazing that you can go from southern Illinois with its 8 to 16 inches of above normal precipitation to Arkansas and Mississippi and find areas that are 8 to 16 inches below normal on precipitation.

Revised Winter Forecast
NOAA’s Climate Prediction Center has revised their winter forecast today. Their earlier outlook for December-February called for increased chances of above normal temperatures in the southern two-thirds of Illinois and above normal precipitation for all of Illinois.
However, December is already shaping up to be on the cold and dry side (see earlier post).
Now their outlook for January calls for equal chances of above, below, and near-normal temperature and precipitation in Illinois. It’s what I call a neutral forecast.
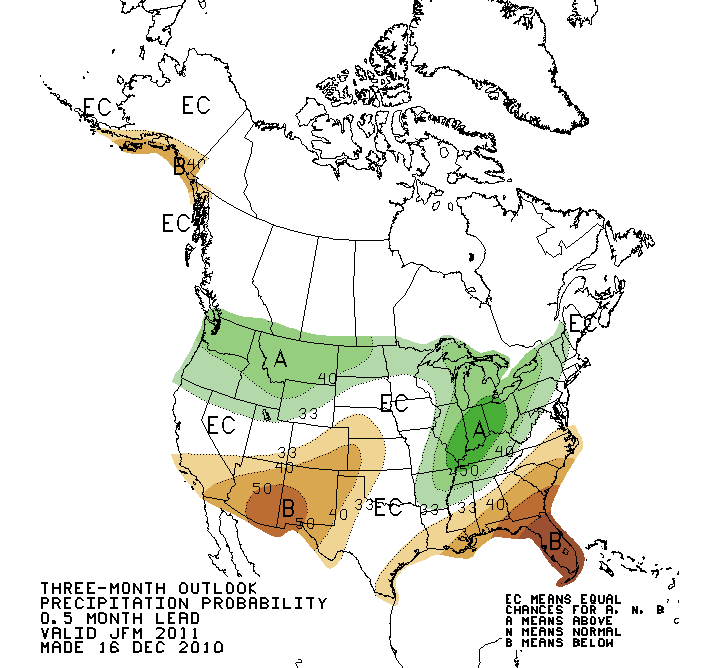
In their forecast for January-March, they call for an increased chance of above-normal precipitation in Illinois as well as much of the Ohio River Valley and Great Lakes region (see map below). Their temperature outlook remains neutral for Illinois for this period.

Updated Forecast for December and Winter
NOAA’s Climate Prediction Center has come out with a new forecast for December and for December-February (winter). This is part of their routine update cycle.
December
The outlook for December in Illinois calls for an increased chance of above normal temperatures. An increased chance of above normal temperatures translates into just a few degrees above normal. Temperatures in Illinois have run an average of 2.9 degrees above normal for every month since March of this year. Therefore, continuing with a forecast for above-normal temperatures is not surprising.
The outlook calls for equal chances of above, below, or near-normal precipitation (or equal chances as they call it) in December in Illinois.
December-February (winter)
The outlook for December-February remains the same as last month. There is an increased chance of above-normal precipitation for all of Illinois. And, there is an increased chance of above-normal temperatures for the southern two-thirds of the state. See the figure below for more details.

July – Warmer and Wetter than Normal
The average temperature for July in Illinois was 77.7 degrees, 1.9 degrees above normal. That’s warm but not record-breaking by any means. By contrast, the average temperature of last July was 70.2 degrees. Not only was this year warmer but it was considerably more humid as well.
The average rainfall for July in Illinois was 5.6 inches, 1.8 inches above normal. BTW, the wettest July on record was 1958 with 8.03 inches.
The largest rainfall totals occurred in western and far northern Illinois as well as an area along I-70. Amounts of 8 to 12 inches were common in these areas.
Southern Illinois was much drier in July with amounts of only 1 to 3 inches in many locations. In fact, the US Drought Monitor categorized southern Illinois as being “abnormally dry” by. Another area of dryness is through central Illinois in an area bound by Moline, Kankakee, Danville, Springfield, and Peoria.

