October Wetter Than Average for Illinois

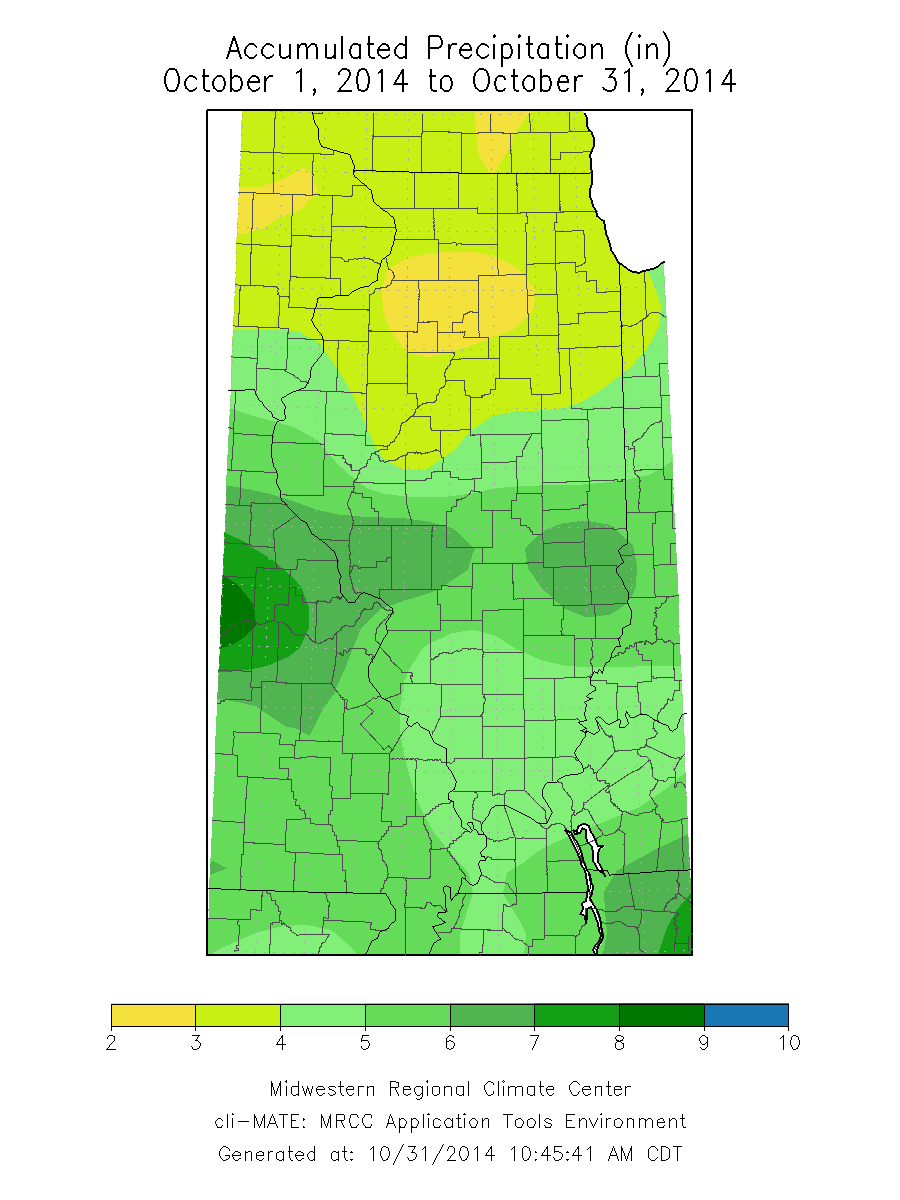
Based on preliminary numbers*, the statewide average precipitation for October in Illinois was 4.5 inches, which is 1.2 inches above average. It was the 15th wettest October since 1895. The wettest October on record for the state was 1941 with 9.06 inches of precipitation.

The largest precipitation totals were in the central third of the state where 6 to 8 inches were common. Greenfield had an incredible 9.94 inches of precipitation. Medora, Girard, and Carlinville also reported over 9 inches of precipitation. Precipitation totals were more moderate elsewhere; 4 to 6 inches in southern Illinois and 2 to 4 inches in northern Illinois. Also, several locations in northeast Illinois reported seeing traces of snow for the month.

The statewide average temperature was 54.0 degrees, 0.1 degrees below average.

*I updated these numbers on November 2 with only a 0.2 degree change in temperature from 54.2 to 54.0 degrees.

MAPS AND PLOTS FOR OCTOBER

map1

map2

The plot of past October precipitation for Illinois (below) shows that things have become slightly wetter over time, about 0.64 inches in the last century. The outstanding October’s of 1941 and 2009 are easily seen as well.

plot1

Year to Date – Cool and Wet in Illinois

It is probably not shocking news to find out that the first 8 months of 2014 have been both cooler and wetter than average for Illinois.

The statewide average temperature for January-August was 50.8 degrees, 3.5 degrees below the 1981-2010 average and tied with 1924 as the fifth coolest on record.

The statewide average precipitation for January – August was 28.79 inches, 1.46 inches above average and the 34th wettest on record.

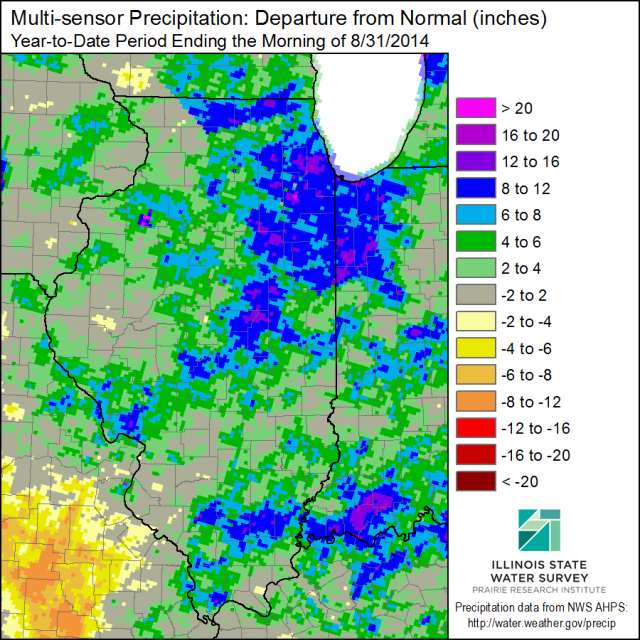
Here is what the precipitation departures look like through the end of August. Several areas in northeast and east-central Illinois have precipitation departures of 6 to 12 inches above average in the shades of blue, and a few areas with 12 to 16 inches above average. Areas in green are 2 to 6 inches above average. Only a few small areas in tan/beige are 2 to 4 inches below average.

IL-prcp-mpe-y2d-dev-20140831

Wet August Wraps Up Cool, Wet Summer in Illinois

Highlights: The 12th wettest August in Illinois finishes out the 10th wettest summer on record. While August was slightly warmer than average, the summer was cooler than average. Here are the statistics.

August Statistics

The statewide average precipitation for August was 5.18 inches, 1.59 inches above average and the 12th wettest on record. The wettest area of the state was Cook County. The largest monthly total was from a CoCoRaHS site (IL-CK-100) in Cicero with 10.20 inches of precipitation.

This first map shows several areas across the state with amounts of 7 to 10 inches (oranges and reds), according to radar estimates. There were a few areas in the northwest and east-central Illinois with only 2 to 3 inches. The second map shows the departures from average, showing the many areas with 2 to 8 inches above average for the month.

IL-prcp-mpe-m2d-tot-20140901


Continue reading “Wet August Wraps Up Cool, Wet Summer in Illinois”

Agricultural Disaster Declaration for Illinois

Governor Quinn announced yesterday that federal disaster assistance is available to help Illinois farmers who suffered crop losses due to flooding this year (full press release).

As noted in the press release, the January-June period was the 4th wettest on record (27.2 inches, 8 inches above average) and an April that was the wettest on record with 7.59 inches.

I have generated a file with the monthly precipitation for 2011 for all available NWS cooperative observer sites in Illinois. The new 1981-2010 monthly precipitation normals for Illinois are posted as well. Additional precipitation data can be found at cocorahs.org using their precipitation summary product. It works best if you select your county and not the state. 

January-June 2011 precipitation
January-June 2011 precipitation for Illinois. The heaviest totals were in southern Illinois. Click to enlarge.


January-June 2011 precipitation departure
January-June 2011 precipitation departure from average for Illinois. Areas in blue had precipitation that was at least 12 inches above average. Click to enlarge.