New Climate Extremes Tool

Someone just pointed out this interesting climate extremes tool from the Southern Regional Climate Center. Here is the URL: http://extremes.srcc.lsu.edu/

From there you can choose the product, which is the type of all-time record – for the month, for the day, or for the year. Then you select your variable: record high, record low, etc. And finally the month of interest.  So far it only does temperatures and is limited to airport data.

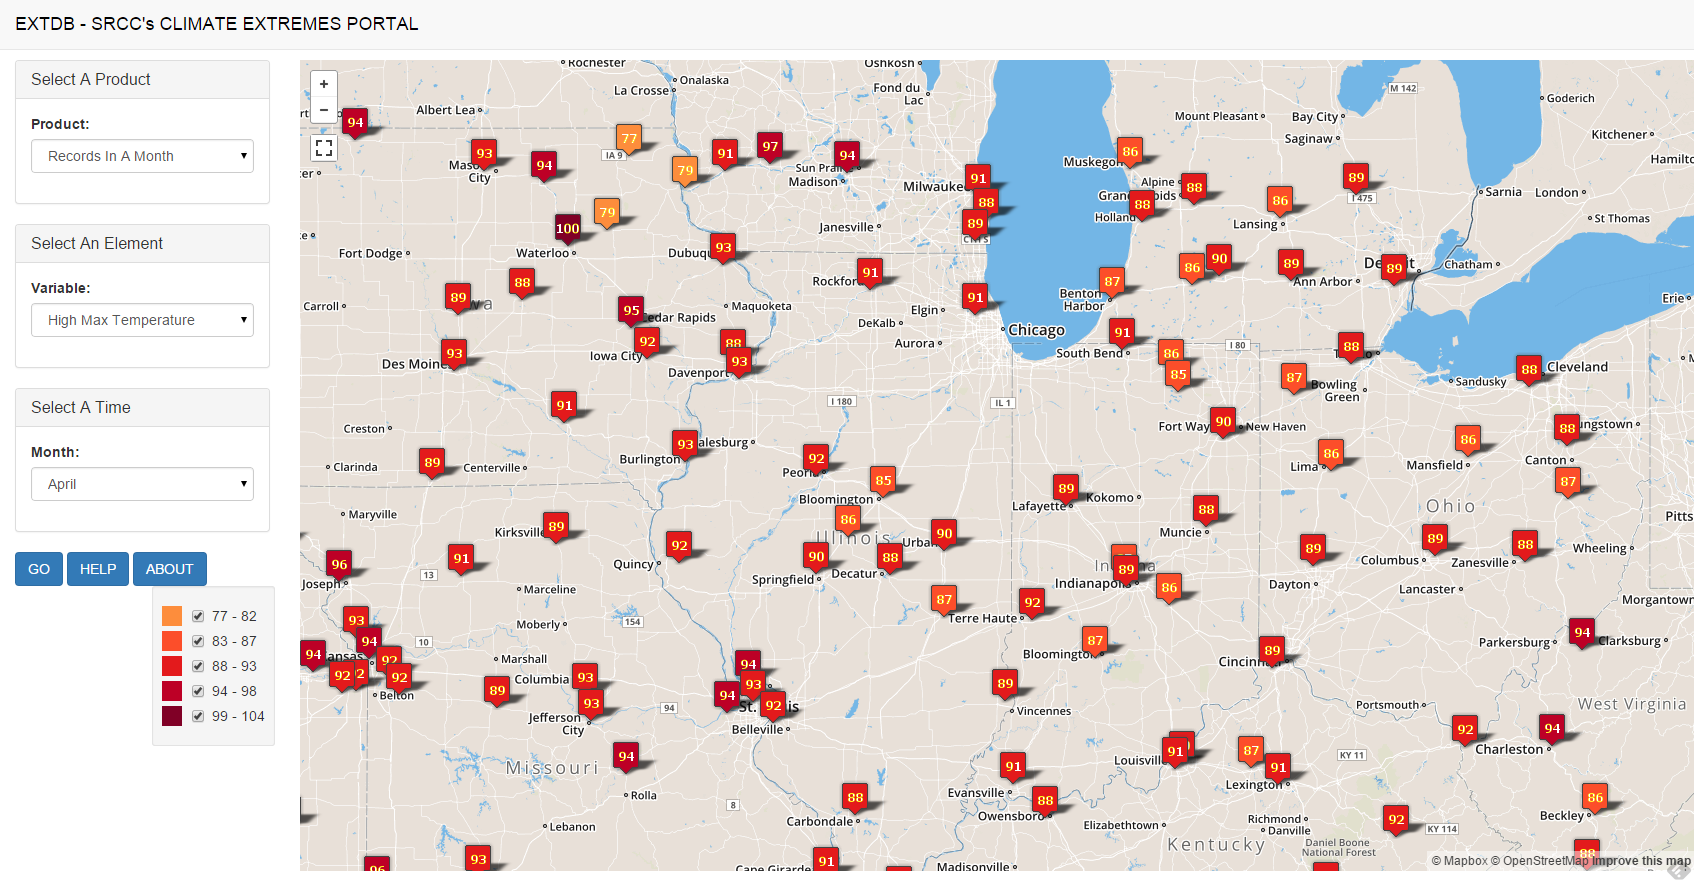
Here is a screen shot of the all-time record highs for April in the Midwest. In the tool, instead of this screen shot, when you mouse over one of the records it gives you more details on the record and dates. It is an interesting tool – I just wish it included the longer NWS Cooperative Observer records.

EXTREMES
Source: Southern Regional Climate Center. Click to enlarge.

Four Odd Tornado Seasons in a Row for Illinois

mapt
Click to enlarge. Source NOAA Storm Prediction Center.

So far the 2015 tornado season in Illinois and the rest of tornado alley is incredibly quiet. There are no tornadoes to report this year, except in the far Southeast and one in California. However, this quiet start is no reason to relax if the past few years are a guide.

Historically, the heart of the Illinois tornado season is March to June with two-thirds of our tornadoes occurring during those months. However, in the last few years, we have had more tornadoes occur outside of this period than inside.

And a lot of these tornadoes have been concentrated in just a few days of the year. In fact, 69 percent of the tornadoes in 2012-14 occurred on just 5 days. These high concentrations can put extra strain on forecasting, warning, and recovery operations.

Here is how 2012, 2013, and 2014 looked, compared to the historical averages. Continue reading “Four Odd Tornado Seasons in a Row for Illinois”

Searching for March Records

If you are interested in daily and monthly weather records, there are a few excellent web sites that can help.

NOAA National Climatic Data Center

The NCDC site http://www.ncdc.noaa.gov/extremes/records/ allows you to look at daily, monthly, and all-time records for sites in a selected state. Records include temperature (highest high, lowest low, etc.), precipitation, and snowfall. The report for March is especially interesting with 352 broken records and 52 tied records for sites in Illinois as of March 27. See the link to the PDF below:
Report from NCDC on record highs set in March 2012

Weather Underground

The folks at weatherunderground.com has a similar page as the NCDC site with slightly different interface and output at http://www.wunderground.com/climate/extremes.asp.