A Very Warm October in Illinois

[Edited on October 26 to reflect update] Based on data through October 25, the statewide average temperature for Illinois in October is 60.7 degrees. That is 6.3 degrees above normal and the fourth warmest October on record. Temperatures for the rest of October are expected to be 3 to 5 degrees above normal. Therefore, this October could slip in the polls. Here are the top ten warmest Octobers

  1. 1963 with 63.6°F
  2. 1947 with 62.2°F
  3. 1971 with 61.3°F
  4. 2016 with 60.7°F
  5. 1900 with 60.6°F
  6. 1956 with 60.2°F
  7. 2007 with 59.9°F
  8. 1897 with 59.7°F
  9. 1950 with 59.3°F
  10. 1920 with 59.2°F

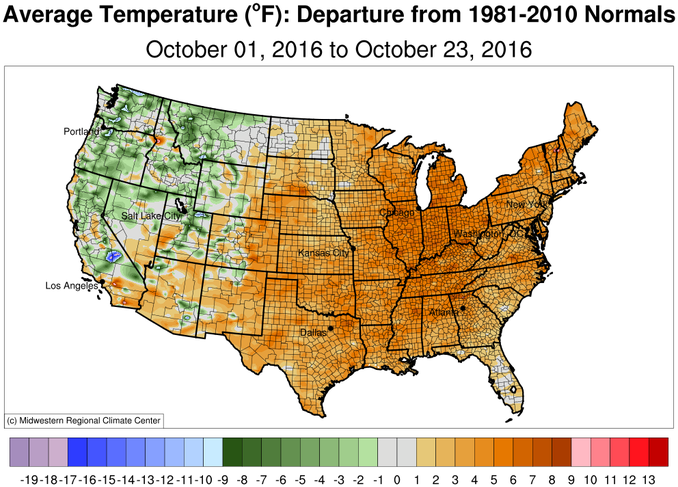
Here are the U.S. temperature departures for October so far . Illinois and the eastern two-thirds of the U.S. are experiencing above-normal temperatures (shown  in various shades of pumpkin spice, appropriately enough). Speaking of pumpkins, the harvest for this year looks much better than last year.
map_btd-1
Continue reading “A Very Warm October in Illinois”

October Warm and Dry So Far in Illinois

October has been both warmer and drier than average so far for Illinois.

Temperatures have run 1 to 2 degrees above average in Illinois and across most of the Midwest (first map). This follows close on the heels of a September that is now considered the 8th warmest on record at 70.4 degrees according to NCEI.

map1

Meanwhile, precipitation has been largely missing in action in October (map below). The areas in gray across Iowa, and parts of surrounding states indicate almost no measurable precipitation has fallen. It’s hard to tell on this map because of the scale, but most of Illinois has received less a tenth of an inch for the month so far. The statewide average is 0.05 inches.   Continue reading “October Warm and Dry So Far in Illinois”

Above-Average Temperatures for April in Illinois

While there were a few cold stretches in April, the statewide average temperature for the month was 54.1 degrees, 1.7 degrees above average.

Precipitation in Illinois for April was more complicated. April precipitation was in the range of two to four inches in northern and central Illinois, and 4 to 7 inches in southern Illinois. As a result, the northern two-thirds of the state was slightly below average while the southern third was up to 2 inches above average. Fort Massac State Park reported the highest monthly precipitation total of 7.80 inches.

prcpmo1
April Precipitation. Click to enlarge.
prcpmo2
April Precipitation Departure. Click to enlarge.

Continue reading “Above-Average Temperatures for April in Illinois”

Warm and Dry for May in Illinois

May 2012

A glance at the forecast for Memorial Weekend shows near record-breaking temperatures in Illinois. Already the statewide average temperature for May 1-22 is 66.1 degrees, and 3.7 degrees above average. It is now in 19th place as far as the warmest May on record. We will see how that changes over the weekend and into next week.

Monthly Temperatures Since 2011

Below are the temperature departures in Illinois since the beginning of 2011. The statewide average temperature in every month in 2012 has been above average in Illinois. As a result, we are now at 48.4 degrees for the period of January – May 22. That makes this January-May the warmest on record. It beats second place by a full 1.1 degrees (47.3 degrees set in 1921). Statewide records go back to 1895. By the way, the summer of 1921 was about 3 degrees above average with average precipitation.
The streak of warmer than average temperatures extends back to October 2011. Also, eight of the 12 months in 2011 had above average temperatures.

Statewide monthly temperature departures for Illinois in 2011 and 2012. Blue bars mean cooler than average. Red bars mean warmer than average. Average is the 1971-2000 statewide average. Illinois State Water Survey 2012. Click to enlarge.