April Temperatures in Illinois Warm Over the Last Century

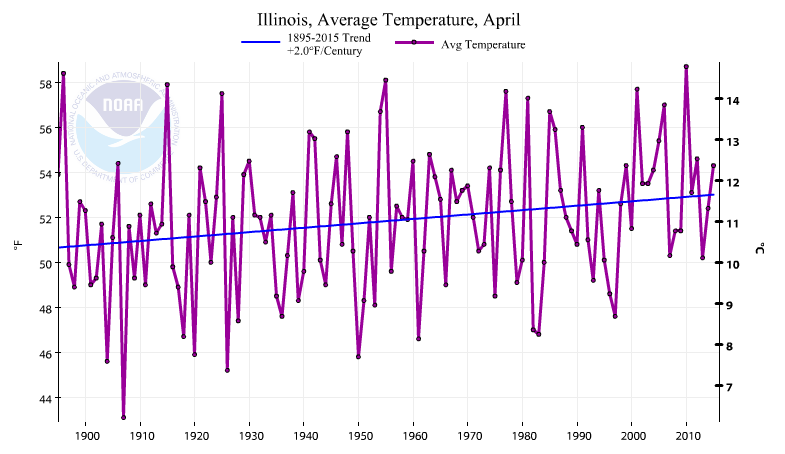
According to the National Centers for Environmental Information (NCEI), the average April temperature in Illinois has warmed by 2 degrees over the last century. In addition, the most recent decade of 2006-2015 was the warmest set of Aprils on record. Statewide records go back to 1895.

Here are the statewide average temperatures for April in Illinois plotted by year. The purple line and black dots show the year-to-year variability in April temperatures in Illinois. The blue line shows the upward trend. You can find the original data and graph here.

ts1

Continue reading “April Temperatures in Illinois Warm Over the Last Century”

Sunny and Dry Start to October

The first 10 days of October have been warm, dry, and sunny in Illinois.  The statewide average temperature is 61.3 degrees, 3.8 degrees above average.
The statewide average precipitation is zero. Only a handful of sites in far western Illinois have reported anything. The highest total so far in the state was 0.44 inches from a CoCoRaHS site near Carthage, Illinois.
The driest October on record in Illinois was 1964 with only 0.20 inches for the entire month. Last year (2010) was the 19th driest October with only 1.35 inches. However, October 2009 was second wettest with 8.40 inches.
Here is a look at how October precipitation has behaved since 1895 in Illinois. The green dots are the individual years. The alternating brown and green shaded area show below and above average precipitation, respectively. The average is based on the period of record (1895-2010). You can see a lot of year to year variability in the numbers and no clear long-term trends.

October precipitation in Illinois from 1895 to 2010. Click to enlarge.