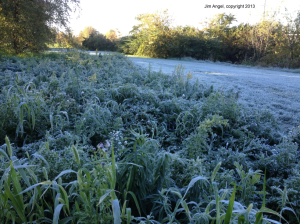
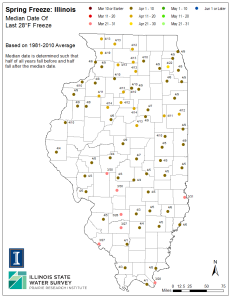
 For much of Illinois April is typically the last month that we see freezing temperatures until Fall (at least we hope). Below are the maps showing the median dates when we see 28 and 32 degrees for the last time in Spring. The median represents the middle value in the range of dates and is less sensitive than the average to unusually early or late dates.
We have more discussion and maps, including the earliest and latest dates of freezes during the 1981-2010 period on our frost webpage.
In addition you can track the status of this spring (2013) in terms of how things stand on hitting 28 and 32 degrees from the Midwestern Regional Climate Center.


New Climate Prediction Center Outlooks
On February 20, the NWS Climate Prediction Center released their new outlooks for March and beyond. Below are the maps for March, spring (March to May), and summer (June to August).
The overall theme for Illinois is an increased chance of above-average temperatures through August. We have an increased chance of above-average precipitation in the March-May period, followed by equal chances in the June-August period. If it pans out, above-average precipitation for this spring should help with low water levels on both the Great Lakes and Mississippi River as well as alleviate drought concerns in northern Illinois.
If you are wondering when was the last time we had a spring that was both warmer and wetter than average, you do not have to look very far. The springs of 2004, 2006, 2009, 2010, and 2011 all qualified as having both above average on precipitation and temperature. In fact, our spring temperatures in Illinois have been at or above average in all but 2 years since 1998 (last figure).


New Spring Outlook – Warmer and Wetter for Illinois
The NWS Climate Prediction Center has released the new outlooks for March as well as March-May.
One of the key things to come into play is the status of La Niña in the Pacific Ocean. A La Niña event occurs when ocean temperatures are colder-than-normal along the eastern part of the Pacific Ocean basin. The associated ocean and atmospheric pattern tends to give us a wet spring in states along the Ohio River Valley. CPC states that “La Niña is likely to transition to ENSO-neutral conditions during March-May 2012.” That’s government-talk for saying that the La Niña event is fading fast and will be gone before the end of spring.
The outlook for March in Illinois calls for an increased chance of above-normal temperatures and above-normal precipitation. The outlook for March-May calls for an increased chance of above-normal temperatures throughout the state. However, it shows an increased chance of above-normal precipitation in the eastern half of the state while the western half has “equal chances” of above-, below-, near-normal precipitation.
The new outlook for June-August (maps below), the heart of the growing season, is for an increased chance of above-normal temperatures in southern Illinois and “equal chances” for the rest of the state. The entire state is in “equal chances” with respect to precipitation.
Just a note on “equal chances”. That’s the NWS way of saying that none of their forecasting techniques are indicating a higher risk of unusual temperature or precipitation patterns.


Seventh Wettest Spring on Record for Illinois
The statewide average rainfall of 5.6 inches in May, combined with the 2.8 inches in March and 7.3 inches in April, resulted in a total rainfall for this spring at 15.7 inches. That makes it the seventh wettest spring on record since 1895 and 4.3 inches above average.
The heaviest spring rains fell in southern Illinois. Cairo reported the highest total rainfall with 30.90 inches, followed by Brookport Dam with 29.19 inches, Du Quoin with 28.95 inches, and Carbondale with 27.59 inches. These numbers are slightly more than double the average spring rainfall totals.
[update June 7] I just found a CoCoRaHS observer near Anna (IL-UN-3) who reported 37.5 inches of rain during those three months. To put that in perspective, the average ANNUAL precipitation for the Anna area is 48 inches.
The statewide average temperature for this spring was 52.0 degrees, which is right on the 1971-2000 average of 52.0 degrees.
Note about “spring”: in climatology, we define spring as March – May. This definition lines up better with our ideas of spring weather than the astronomical definition of March 20 (equinox) to June 21 (solstice). In much of Illinois, spring weather starts to arrive before March 20 and summer weather starts to arrive before June 21.


