According to the USDA, corn and soybean conditions in Illinois are not as good as the last two years.
The USDA NASS site has lots of interesting agricultural data, if you know where to look. One of the great reports they put out every week are the crop conditions in graphical form. Just click on a state and go.
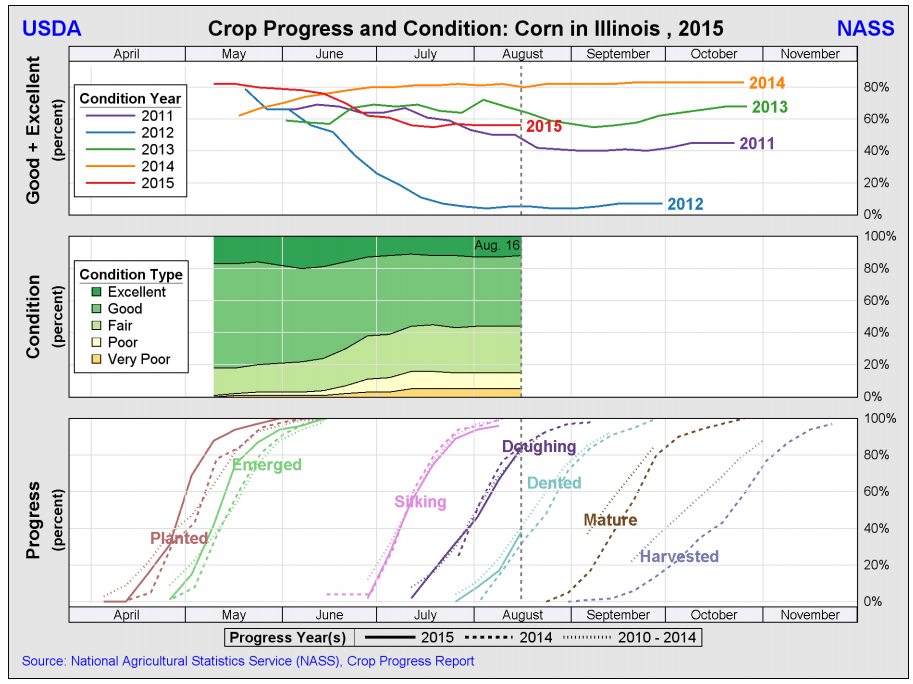
In this first graph, you can see the corn crop conditions compared to earlier years. The percent in good to excellent for 2015 is less than 2013 and 2014. It is a little better than 2011, which was hot and dry in places. It was better than 2012 when we had the full blown drought. The second panel shows you the crop conditions in all categories throughout the 2015 growing season. And finally you can see the crop stages this year, compared to last year and the 5-year average.
The USDA has produced some interesting slides for the World Agricultural Outlook Board, showing the current drought overlaid on production areas. The first two are about the U.S. corn production areas, then the soybean areas, and finally the cattle areas. Each pair of slides shows a map of the overlay, and a time series of the area affected by drought.
By July 24, about 89 percent of the corn production area was in drought. That percentage has been climbing steadily since early June. It’s the same story with 88 percent of the soybean production area and 73 percent of the cattle production area in drought. Click to enlarge. Click to enlarge. Click to enlarge. Click to enlarge. Click to enlarge. Click to enlarge.
Governor Quinn announced yesterday that federal disaster assistance is available to help Illinois farmers who suffered crop losses due to flooding this year (full press release).
As noted in the press release, the January-June period was the 4th wettest on record (27.2 inches, 8 inches above average) and an April that was the wettest on record with 7.59 inches.
January-June 2011 precipitation for Illinois. The heaviest totals were in southern Illinois. Click to enlarge.
January-June 2011 precipitation departure from average for Illinois. Areas in blue had precipitation that was at least 12 inches above average. Click to enlarge.
There is a new way to look at drought stress in Illinois – from space. Called VegDRI, this product integrates “satellite-based observations of vegetation conditions, climate data, and other biophysical information such as land cover/land use type, soil characteristics, and ecological setting. The VegDRI maps that are produced deliver continuous geographic coverage over large areas, and have inherently finer spatial detail (1-km resolution) than other commonly available drought indicators such as the U.S. Drought Monitor,” according to the VegDRI website.
In other words, it looks at crop stress as it relates exclusively to drought. The maps are updated every two weeks.
The August 22, 2011, map below shows that crops in much of western and central Illinois are showing much stress from the lack of rain and high temperatures in July and August. If you go to the VegDRI website, you can see a national map. Click on a state to get a closer view. Scroll down the state page and click on the quadrant map of the state so see even more detail. VegDRI map for Illinois for August 22, 2011. Click to enlarge. VegDRI map for east-central Illinois for August 22, 2011. With this level of detail, changes within a county are easily seen. Click to enlarge.
The National Drought Mitigation Center produces VegDRI in collaboration with the US Geological Survey’s (USGS) Center for Earth Resources Observation and Science (EROS), and the High Plains Regional Climate Center (HPRCC), with sponsorship from the US Department of Agriculture’s (USDA) Risk Management Agency (RMA). Main researchers working on VegDRI are Dr. Brian Wardlow and Dr. Tsegaye Tadesse at the NDMC, and Jesslyn Brown with the USGS, and Dr. Yingxin Gu with ASRC Research and Technology Solutions, contractor for the USGS at EROS.


 Continue reading “Corn and Soybean Conditions in Illinois Are Not as Good as Last Two Years”


