October Was Warm and Dry in Illinois

Precipitation

For Illinois, the statewide average rainfall for October was 1.4 inches, 1.5 inches below normal or 48 percent of normal. This ranks as the 20th driest October on record. The largest monthly rainfall total was reported at Belvidere with 3.94 inches. See map below for rainfall departures across the state.
While northern Illinois was close to normal on rainfall in October, parts of southern and eastern Illinois remained dry. The U.S. Drought Monitor lists those areas as “abnormally dry” and southeastern Illinois as”moderate drought”. At this time of year, the main impacts on agriculture would be on pasture conditions and winter wheat.

Soil Moisture

With the vegetation preparing for a long winter’s nap and lower temperatures, the demands on soil moisture are close to zero. So soil moisture should start to recover in the next few months even if precipitation remains below normal. The Illinois State Water Survey posts their latest soil moisture survey a few days after the end of the month here.

Temperature

The statewide average temperature for October was 56.2 degrees, 1.6 degrees above normal. The highest temperature for the month was reported at Fairfield with 93 degrees on October 10. The lowest temperature for the month was reported at Minonk with 22 degrees on October 29 and Sidell with 22 degrees on October 30.

Frost

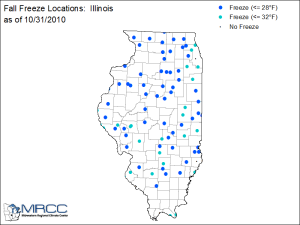
During October, nearly all of Illinois has experienced temperatures down to 32 degrees and many areas have reached 28 degrees or less. See map below.

Figures
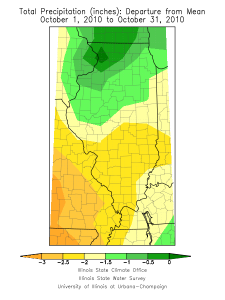
 

October rainfall Illinois
October rainfall departures from normal.

freeze Illinois
Occurrence of Frost (32F) and Freeze (28F) in Illinois at end of October 2010.


All data are preliminary.

More on Soil Temperatures in Illinois

Here are the average dates in fall when the 4-inch soil temperature falls below 50 degrees (left panel) and below 60 degrees (right panel). Consider these as a “rule of thumb” for planning purposes. Consult the current soil temperatures, as discussed in the earlier post, for decisions on applying nitrogen in the fall.
 

Average date when 4-inch soil temperature drops below 50 and 60 degrees.
Average date in fall when the 4-inch soil temperature drops a) below 50 degrees, and b) below 60 degrees.


Daily Soil Temperatures Across Illinois

The Illinois State Water Survey operates a network of 19 sites that report daily soil temperatures at 4 and 8 inches.
Soil temperatures in the fall are critical for the application of nitrogen (N) fertilizer. According to the Agronomy Handbook (University of Illinois), “fall N applications should be done when daily maximum bare soil temperature at 4 inches is below 50 degrees.”
The daily maximum and minimum soil temperatures are measured over grass. In addition, the values are adjusted using regression to estimate the bare soil temperatures, to better represent the soil temperatures in a cultivated field. Grass tends to insulate the soil so the daily temperature swing is a little smaller than over bare ground. In addition,  soil temperatures within a particular field may vary due to soil color, soil moisture, and crop residue on the surface.
You can see the daily data and maps at http://www.isws.illinois.edu/warm/soiltemp.asp