Illinois Ranked Fourth in Nation in Number of Tornado Reports in 2015

According to the NOAA Storm Prediction Center, Illinois is ranked fourth in the nation for the number of tornado reports in 2015. Here are the top five states:

  1. Texas with 164 reports
  2. Kansas with 150 reports
  3. Oklahoma with 100 reports
  4. Illinois with 64 reports
  5. Colorado with 48 reports
April 9, 2015. Click to enlarge.

The most outstanding event for 2015 was the April 9 outbreak that produced 11 tornadoes, including a rare EF-4 tornado. The map on the left shows all the severe weather reports for that day. More on this outbreak can be found here.

The map below is for all the tornado reports across the US in 2015. Many of the Illinois tornadoes occurred in far northern and far southern Illinois this year, while central Illinois has been relatively quiet. Continue reading “Illinois Ranked Fourth in Nation in Number of Tornado Reports in 2015”

Historical Tornadoes in Illinois and the US

While tornadoes can happen any time of the year, the tornado season really starts to ramp up in March in Illinois (see plot below) and remains active through the spring and on into summer. April, May, and June are the three standout months historically. So far 2015 has been very quiet with no severe weather reported in Illinois so far, according to NOAA.

tornado-month

You can see more plots like this on our tornado plots page.

Historical Tornado Tracks

Continue reading “Historical Tornadoes in Illinois and the US”

Tracking Tornado Statistics in the US (Part II)

Yesterday I mentioned the national archive as a source for reports on tornadoes and other forms of severe weather. Today I wanted to mention the NOAA Storm Prediction Center and the many statistical products they have available on their website. Of course, their primary mission is to provide forecasts but they have accumulated an impressive collection of other products as well.

Local Storm Reports

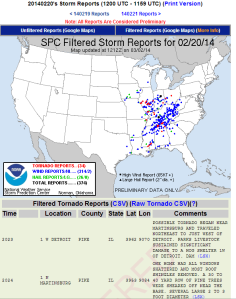
While these are preliminary and subject to change later, one of the best and longest-lived product the SPC provides are the daily storm reports. These are dot maps showing tornadoes, wind and hail damage, with a detailed list below the map showing dates, times, cities, counties, type of damage. You can see “today” and “yesterday” or pick your own date. See example below (click to enlarge).

example1

Monthly and Annual Tornado Summary

This page starts by giving you a table of running totals of tornadoes and tornado deaths for this year, and the last 3 years, plus the 3-year average. So as of April 3, we have 81 tornadoes reported across the US with zero deaths.

TORNADO TOTALS AND RELATED DEATHS...THROUGH THU APR 3 2014
NWS STORM PREDICTION CENTER NORMAN OK
0833 AM CDT FRI APR 04 2014

       ...NUMBER OF TORNADOES...  NUMBER OF          KILLER
                                  TORNADO DEATHS     TORNADOES
    ..2014.. 2013 2012 2011 3YR                 3YR             3YR
    PREL ACT  ACT  ACT  ACT  AV   14  13  12 11  AV  14 13 12 11 AV
---  --   -- ---  ---- ---- ----  --  -- --- -- ---  -- -- -- -- --
JAN   4   --   75   79  16   57    0   1   2  0   1   0  1  2  0  1
FEB  41   --   39   57  63   53    0   1  15  1   6   0  1  7  1  3
MAR  25   --   18  154  75   82    0   0  43  1  15   0  0 10  1  4
APR  11   --   86  206 758  350    0   1  6 363 123   0  1  1 43 15
MAY  --   --  268  121 326  238   --  41  0 178  73  --  5  0  9  5
JUN  --   --  125  111 160  132   --   1   4  3   3  --  1  2  1  1
JUL  --   --   72   37 103   71   --   0   0  0   0  --  0  0  0  0
AUG  --   --   46   38  57   47   --   0   0  2   1  --  0  0  2  1
SEP  --   --   21   39  51   37   --   0   0  0   0  --  0  0  0  0
OCT  --   --   61   37  23   40   --   0   0  0   0  --  0  0  0  0
NOV  --   --   79    7  44   43   --   8   0  5   4  --  3  0  2  2
DEC  --   --   18   53  15   29   --   2   0  0   1  --  2  0  0  1
---  --   --  ---  ---- ---- ----  --  -- --- -- ---  -- -- -- -- --
SUM  81   --  908 939 1691 1179    0  55  70 553 227  0  14 22 59 33

PREL = 2014 PRELIMINARY COUNT FROM ALL NWS LOCAL STORM REPORTS.
ACT  = ACTUAL TORNADO COUNT BASED ON NWS STORM DATA SUBMISSIONS.

COMPARISONS BETWEEN PRELIMINARY AND ACTUAL COUNTS SHOULD BE AVOIDED.

..CARBIN..04/04/2014

And if you look beyond the table you can get a year by year summary for the US. For example, here is the summary for 2014 so far.

example3


I like to check the Illinois statistics periodically so I choose the year and then the state and look at reports like this one …

example2


Annual Fatal Tornado Summary

This is a nice, modern interface for mapping fatal tornadoes across the US.

Annual Fatal Tornado Summaries

Warning Coordination Meteorologist page

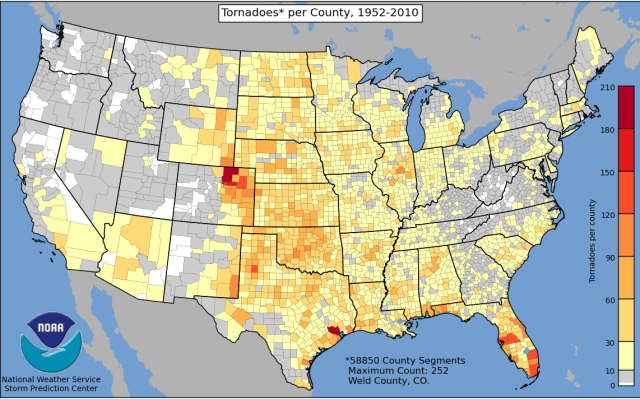
Because this page is geared towards NWS meteorologists, it has more extensive and technical information than the other pages. However, it has lots of information of general information. You can find maps of tornadoes by year, basic tornado climatology, number of watches issued by year, severe weather databases, and GIS support. For example, you can find the map of the number of tornadoes by county across the US.

tornadoes-by-county

Extreme Weather Year in the US

This year has been noteworthy for the number of extreme events across the U.S. In fact, we have had 12 disasters that have exceeded $1 billion in losses each in 2011. We also experienced some $50 billion in total losses for the year. And that is with a fairly quiet hurricane season. Some of those billion dollar disasters had direct impacts on Illinois, including the February blizzard, and the spring flooding.
You can read more about the major disasters this year at http://www.noaa.gov/extreme2011/
NOAA is promoting a new concept called a “Weather Ready Nation”. The idea is to be better prepared and to better respond to weather/climate disasters. This involves better forecasts, better dissemination of forecasts, and closer working relationships among federal, state, and local partners. I’m sure we will hear more about this in coming months.
[Update: The method used to generate the bar-plot part of this graph is apparently flawed. While the line plots show both actual damages and damages adjusted for the Consumer Price Index, they did not make a similar adjustment on the number of 1 billion dollar event. As a result, the number of 1 billion dollar events will climb as prices climb (for example, the destroyed $100k home in 1980 would be worth $250k in 2011). See http://rogerpielkejr.blogspot.com/2012/01/bad-economics-at-noaa.html.]

Click to enlarge.