Monthly Temperature and Precipitation Departures for 2014 for Illinois

Here are the monthly temperature and precipitation departures for 2014. September joins January, February, March, and July as much cooler than average months. For precipitation, we noted last month that we were regularly alternating between wetter- and drier-than-average months in 2014. That changed in September with two months in a row of wetter-than-average conditions.

image005

Continue reading “Monthly Temperature and Precipitation Departures for 2014 for Illinois”

Fifth Coolest January-July For Illinois

Temperature

The statewide temperature in Illinois for the January-July period this year stands at 47.5 degrees, 3.9 degrees below average and the 5th coldest January-July on record for the state. It is no surprise why this would be the case. The bar graph below shows the monthly temperature departures from average (1981-2010) for 2014 in Illinois. The much-below-average temperatures of January, February, and March standout as well as for July.
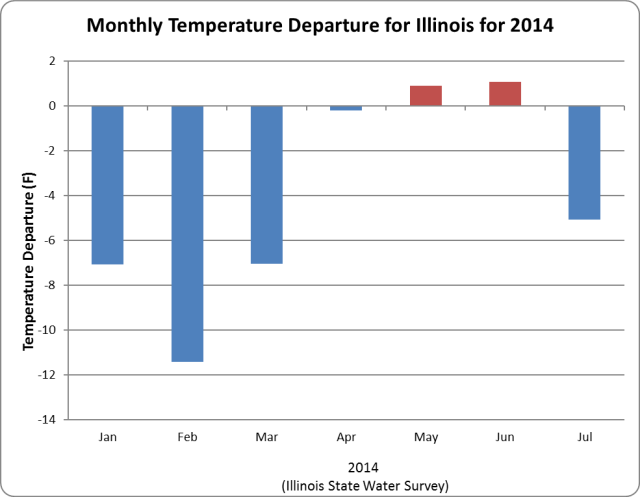
image005

Precipitation

This graph is for monthly precipitation departures from average for 2014 in Illinois. Precipitation seems to be doing a good job of alternating between above and below-average months. In fact, the statewide precipitation departure to date is very close to zero.

image009

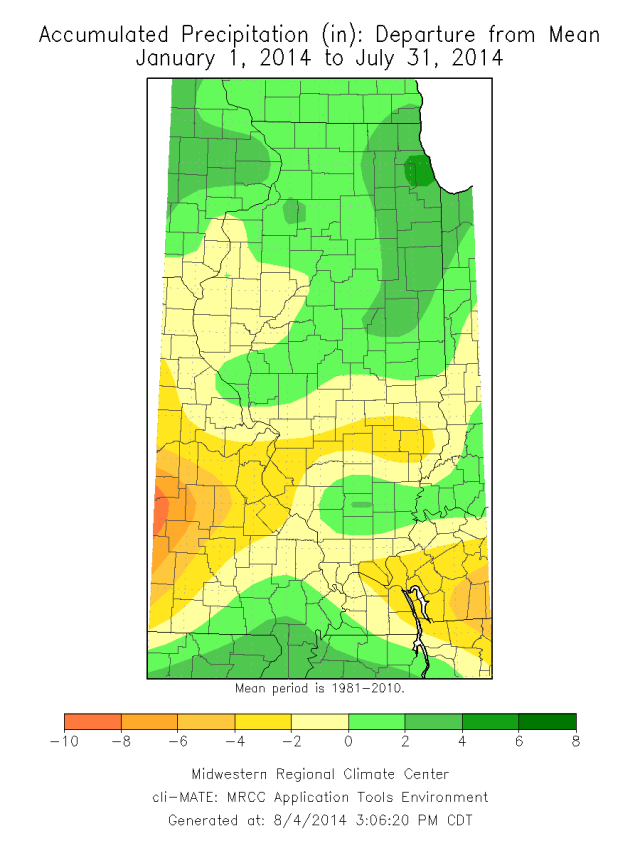
Here are the precipitation departures from average across Illinois. The areas in the lightest shade of green are 0 to 2 inches above average. The areas in the lightest tan are 0 to 2 inches below average. There is a band of wetter conditions in the northeast and a band of drier conditions close to Interstate 70. map_btd
 

Temperatures and Precipitation By Month in 2013

Here are the monthly temperature and precipitation departures from the long-term average by month in Illinois for 2013. After a warmer-than-average January, temperatures have been below-average in February, March, and April. Monthly precipitation has been above-average in January, February, and April, but slightly below-average in March.
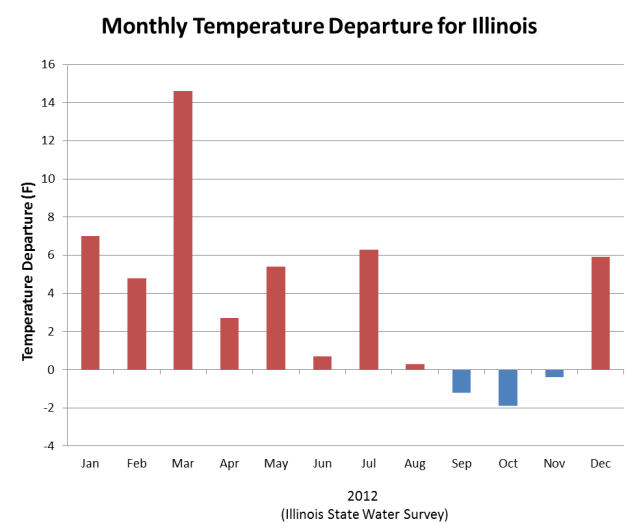
This is a far cry from the first four months of 2012 which were noteworthy for being both above-average on temperatures and below-average on precipitation. See the second pair of figures for 2012.

image005
Monthly temperature departures from the long-term average for 2013 in Illinois. Click to enlarge.

Monthly precipitation departures from the long-term average for 2013 in Illinois. Click to enlarge.

image003
Monthly temperature departures from the long-term average for 2012 in Illinois. Click to enlarge.

Monthly precipitation departures from the long-term average for 2013 in Illinois. Click to enlarge.
Monthly precipitation departures from the long-term average for 2012 in Illinois. Click to enlarge.

2nd Warmest January to November on Record for Illinois

The statewide average temperature in Illinois for January to November this year was 57.3 degrees, based on preliminary data. That is 3.1 degrees above normal and the second warmest on record back to 1895. Only 1921 was warmer with 57.6 degrees. This was in spite of a fall where the statewide average temperature was 52.7 degrees and 1.5 degrees below normal. Most of the above-normal warmth occurred in the January to July time frame. See graph below.
As mentioned earlier, the statewide average precipitation in Illinois for January to November this year was 27.6 inches and the 12th driest on record. This was in spite of a fall where the statewide average precipitation was 10.13 inches, 0.16 inches above normal. The graph below illustrates the beginning of a drought recovery in September and October before the dry November.

Statewide average temperature for Illinois as a departure from the 1981-2010 normal.
Statewide average temperature in Illinois for 2012 as a departure from the 1981-2010 normal.

Statewide.
Statewide average precipitation in Illinois for 2012.