Above-Average Temperatures for April in Illinois

While there were a few cold stretches in April, the statewide average temperature for the month was 54.1 degrees, 1.7 degrees above average.

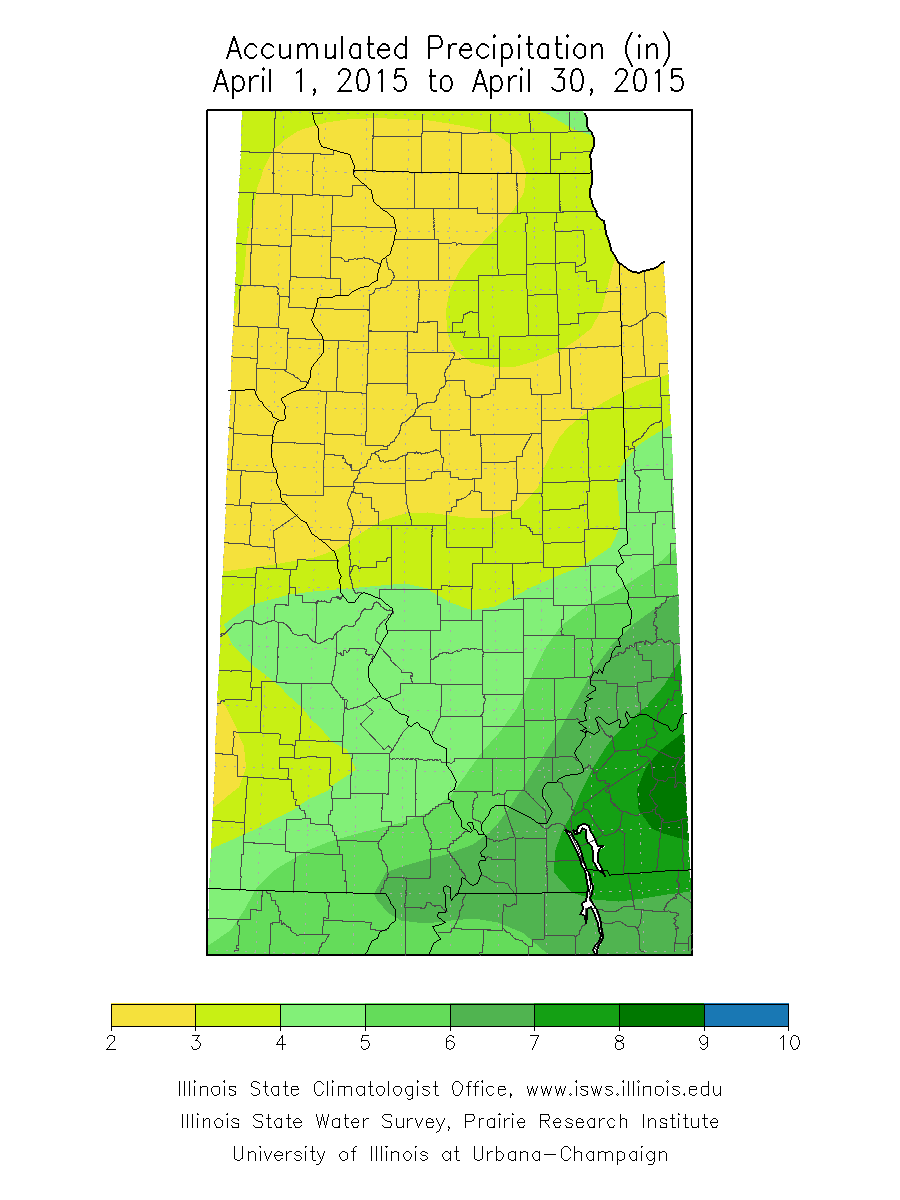
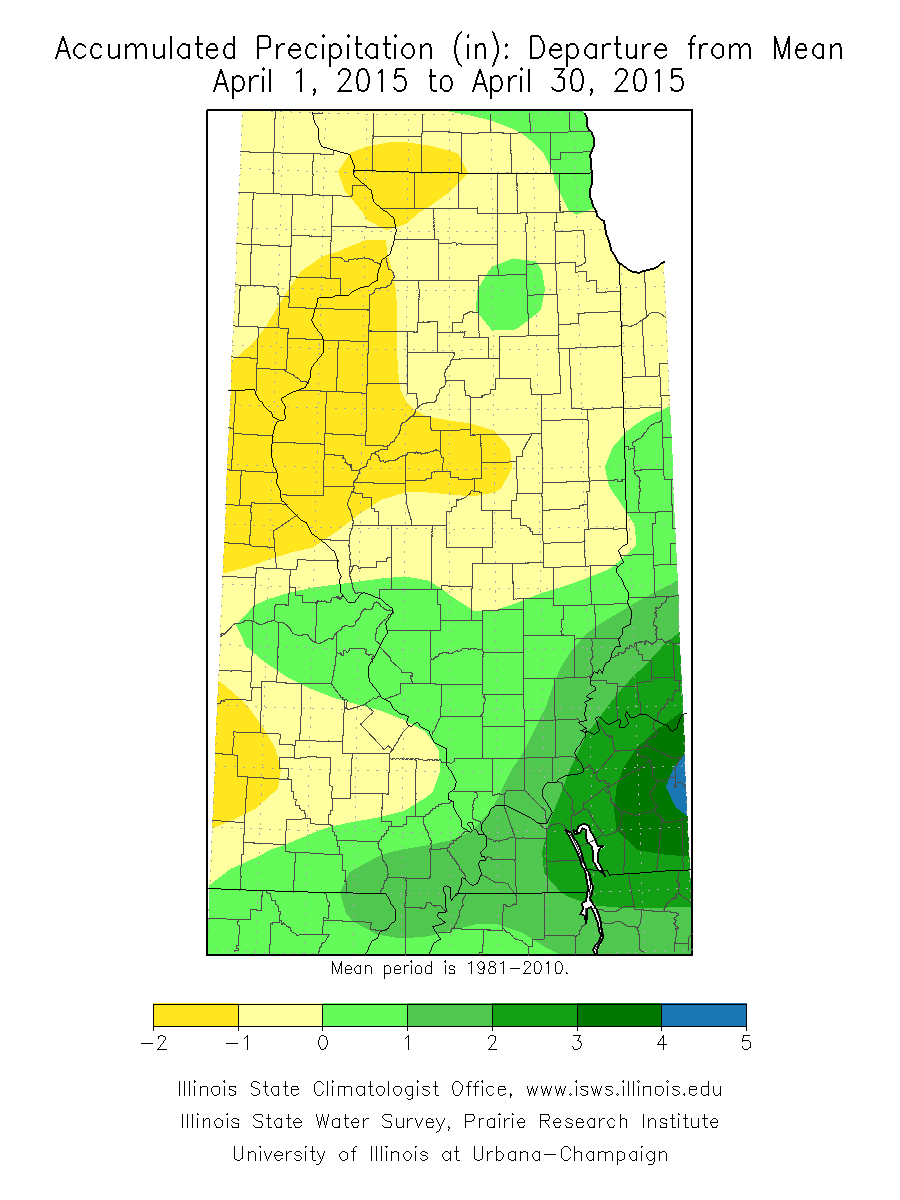
Precipitation in Illinois for April was more complicated. April precipitation was in the range of two to four inches in northern and central Illinois, and 4 to 7 inches in southern Illinois. As a result, the northern two-thirds of the state was slightly below average while the southern third was up to 2 inches above average. Fort Massac State Park reported the highest monthly precipitation total of 7.80 inches.

prcpmo1
April Precipitation. Click to enlarge.
prcpmo2
April Precipitation Departure. Click to enlarge.

Continue reading “Above-Average Temperatures for April in Illinois”

Cold Start to November in the Midwest

So far, November has been cooler than average across Illinois and the eastern two-thirds of the Midwest (below). The statewide average temperature is about 5 degrees below average.

The NWS forecasts indicate that temperatures are likely to stay below-average for the next two weeks across Illinois and the Midwest. The second and third maps are the latest NWS 6-10 and 8-14 day forecasts.

map_btd

610temp.new814temp.new

El Nino and the Midwest

NOAA has released a new 2-page fact sheet on El Niño and the Midwest (links below). Several people in the Midwest had input into this, including myself. El Niño typically results in warmer and drier than average winters. Confidence in these patterns is higher during stronger El Niño events.

Right now the NOAA Climate Prediction Center states that El Niño is favored to begin in the next 1-2 months and last into spring of 2015. The current thinking is that the odds are 2-in-3 in favor of it arriving and that the event will likely remain weak throughout its duration.

PDF version: EN-MW-Sep2014

Online version:

[scribd id=242836832 key=key-2ql4MIpJSjgpfv25L5Zd mode=scroll]

Cool Maps of the Cool July

I will admit it – ever since I was a kid I have been fascinated/obsessed with maps. It is probably why I ended up in a career in climatology since we use maps all the time.

Here are maps from the National Climatic Data Center showing how cool July was across the Midwest. The regions are called “climate divisions” and there are nine of them in Illinois. The ones in the darkest blue had their coolest July on record, with records going back to 1895. Click on the map for a larger version which shows the numbers more clearly.

You can read more about what happened in the US in July.

July Temperature Ranking. Click to enlarge. Source National Climatic Data Center.

And here are the temperature departures from the 1981-2010 average.

July Temperature Departures. Click to enlarge. Source National Climatic Data Center.

Here is the US map for July, showing that while the Midwest was cool, the western US was experiencing record warmth.

july-us
Click to enlarge. Source National Climatic Data Center

This temperature pattern across the United States is the result of a ridge of high pressure over the western US and a trough of low pressure over the central US throughout most of July.

july-upper