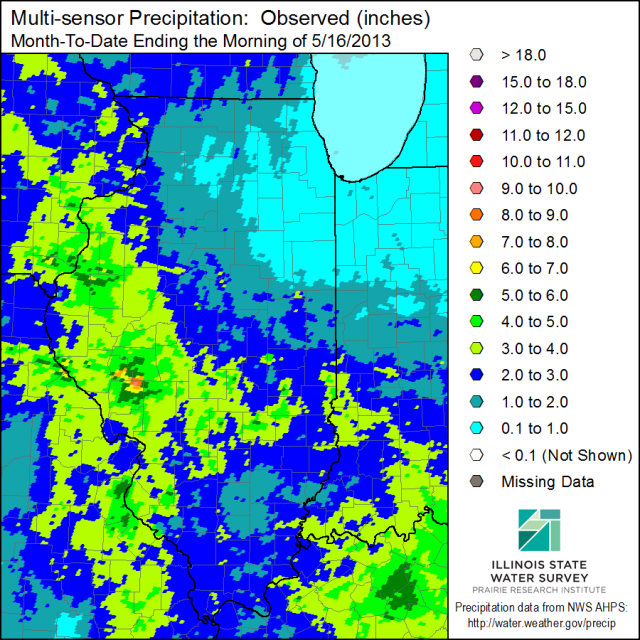
Here is the latest map of May precipitation in Illinois through the morning of May 16, showing the generally wetter conditions in western Illinois and parts of southern Illinois. Amounts were on the order of 3 to 6 inches with a few heavier amounts around White Hall. Areas in the southeast, east-central and much of northern Illinois were drier with amounts of 0.5 to 2 inches common.
There was a strong relationship between temperature and precipitation this month (second figure). Areas with heavier rainfall amounts (western and southwestern IL) had temperatures 2 to 4 degrees below average. Meanwhile areas in east-central and northern Illinois had temperatures near to slightly above average.


Warmest Spring on Record for Illinois
Temperature This Spring
In climatology we use the three whole months of March, April, and May as spring. It makes more sense than the astronomical definition of the March 20 – June 20. As this year demonstrates, summer-like conditions arrive long before the summer solstice. This year the statewide average temperature for spring in Illinois was 59.1 degrees. That makes it the warmest spring on record for Illinois. The statewide records go back to 1895. The five warmest springs in Illinois were:
- 2012 with 59.1 °F
- 1977 with 57.3 °F
- 1921 with 56.0 °F
- 1991 with 56.0 °F
- 2010 with 55.4 °F
May
The statewide average temperature for May in Illinois was 68.1 degrees. That is 5.7 degrees above normal and the 5th warmest May on record, based on preliminary data. The five warmest month of May were:
- 1962 with 69.5 °F
- 1977 with 68.9 °F
- 1896 with 68.8 °F
- 1991 with 68.5 °F
- 2012 with 68.1 °F
Year to date
It was the warmest January-May on record in Illinois with an average temperature of 48.8 °F. What’s interesting is that out of the top five warmest January-May periods, three have occurred in the last 15 years.
- 2012 with 48.8 °F
- 1921 with 47.3 °F
- 1998 with 46.3 °F
- 2006 with 45.8 °F
- 1938 with 45.6 °F
Precipitation
The statewide average precipitation for May in Illinois was 2.4 inches. That is 1.8 inches below normal and 57 percent of normal. That makes it the 21st driest May on record. The driest May was 1934 with 1.03 inches.
The statewide average precipitation for spring in Illinois was 7.71 inches. That is 3.65 inches below normal and the 18th driest spring on record. The driest spring on record was 1934 with 5.16 inches. In case you are wondering, 1988 was the eleventh driest spring at 6.87 inches.
The May 29 US Drought Monitor has several areas in Illinois in “abnormally dry” conditions and far southern Illinois in moderate drought. The good news is that significant rains fell in northwestern Illinois after the map was released so some of those abnormally dry conditions in that part of the state have been washed away.

May in Illinois – Above Average Rainfall
Precipitation
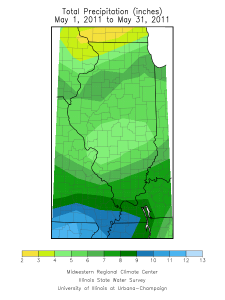
It should come as no surprise that the May 2011 statewide average rainfall was 5.60 inches, and 1.34 inches above the 1971-2000 average. In the first half of May, the rainfall distribution was lopsided with southern Illinois getting 3-5 inches of rain while much of the rest of the state had less than 2 inches. But the rest of the state caught up in the second half of the month.
For May, the two sites with the heaviest rainfall totals in the NWS cooperative observer network were near the Quad Cities: Woodhull with 9.92 inches and Altona with 9.28 inches. From the CoCoRaHS network, the two sites with the heaviest rainfall totals were on opposite ends of the state: Anna with 10.04 inches and Algonquin with 9.12 inches.
Here is an amazing thing about the statewide May rainfall – they are almost the same in the last four years:
- 2011 – 5.60 inches
- 2010 – 5.59 inches
- 2009 – 5.65 inches
- 2008 – 5.39 inches
Temperature

May Finished both Wetter and Warmer
For Illinois, the preliminary statewide average temperature was 64.1 degrees, 1.3 degrees above normal. Basically the first 17 days of the month ran on the cool side (1.4 degrees below normal) while the rest of the month ran on the warm side (4.8 degrees above normal). The map below shows the temperature departures.
The statewide average rainfall was 5.68 inches, 1.42 inches above normal or 133% of normal. The heaviest amounts for the month were in western Illinois between Quincy and the Quad Cities. Dallas City, along the Mississippi River, reported 9.07 inches for the month.


