No Surprise – July was Hot and Dry for Illinois

July was one of the hottest and driest on record. So was the year to date. Here are how things stack up so far.

How July Ranks

This July was the second warmest and fourth driest on record in Illinois, based on preliminary numbers for the month. The statewide average temperature was 81.8 degrees, 6.4 degrees above normal (1981-2010 average). The statewide average precipitation was 1.47 inches, 2.58 inches below normal or 36 percent of normal.
Statewide Average Temperature Rankings for July in Illinois

  1. 1936:  83.1 ºF
  2. 2012:  81.8 ºF 
  3. 1901:  81.7 ºF
  4. 1934:  81.3 ºF
  5. 1916:  80.4 ºF

Statewide Average Rainfall Rankings for July in Illinois

  1. 1930:  1.02 inches
  2. 1916:  1.23 inches
  3. 1936:  1.24 inches
  4. 2012:  1.47 inches 
  5. 1914:  1.51 inches

I think July 1936 still wins the prize as the most miserable month in Illinois records with the hottest temperatures and the third driest rainfall total. I’m sure 1916 was no fun either as the fifth warmest and second driest July on record. Of course, air-conditioning was pretty much non-existent in 1936. My dad says he remembers sleeping outside that July on the family farm in western Illinois (near Nebo) because the house was too hot.

How the Year-to-Date Ranks

This year so far is the warmest and third driest on record. The statewide average temperature for January-July 2012 was 56.9 degrees, 5.5 degrees above normal. The statewide average precipitation for January-July was 14.05 inches, 9.82 inches below normal or 59 percent of normal.
Statewide Average Temperature Rankings for January-July

  1. 2012:  56.9 ºF
  2. 1921:  56.1 ºF
  3. 1987:  54.1 ºF
  4. 1998:  54.0 ºF
  5. 2006:  53.9 ºF

Statewide Average Precipitation Rankings for January-July

  1. 1936:  12.22 inches
  2. 1934:  13.55 inches
  3. 2012:  14.05 inches
  4. 1988:  14.60 inches
  5. 1914:  15.20 inches

Rainfall Map

This rainfall map was generated by our GIS specialist Zoe and uses NWS radar and rain gauge data. The result is a more detailed picture of the rainfall in July 2012. A few lucky areas in northeastern and far southern Illinois received 2 to 4 inches of rain. Most of the state got an inch or less.

Image courtesy of the Midwestern Regional Climate Center. Click to enlarge.

July Rainfall in Illinois Varied from Too Dry to Too Wet

The statewide average rainfall for July in Illinois was 4.12 inches, only 0.29 inches above average. However, rainfall across the state varied widely from too dry to too wet.
Rainfall amounts in the northern third of the state were impressive with widespread areas in excess of 6 to 8 inches. The heaviest rains fell around Galena. A CocoRaHS observer (IL-JD-2) reported a monthly rainfall total of 19.21 inches while the nearby Galena NWS Coop observer reported 17.78 inches. In nearby towns:

  • Elizabeth reported 16.74 inches (NWS),
  • Freeport reported 12.08 inches (CoCoRaHS), and
  • Mt. Carroll reported 11.33 inches (NWS).
Chicago O’Hare airport had a July rainfall total of 11.15 inches, their wettest July on record, thanks largely to the 6.86 inches that fell in three hours on July 23.

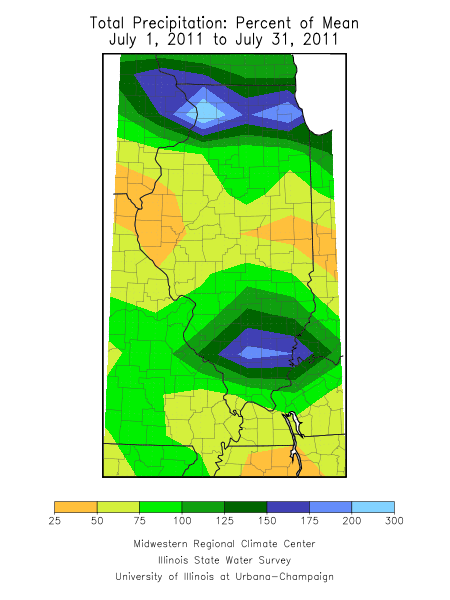
The middle third of Illinois was exceptionally dry. Some of the smaller rainfall totals for July were just south and west of the heavy rainfall in northwest Illinois. One of the drier sites was Aledo with only 0.55 inches. Amounts of only 1 to 2 inches were common in central Illinois. This equates to rainfall departures that were generally 50-75 percent of average (or worse) across the region. Champaign-Urbana experienced its 20th driest July on record with only 1.58 inches, 3.12 inches below average. Springfield reported 1.09 inches and Peoria reported 1.66 inches.
The southern third of Illinois was wet, where amounts of 4 to 8 inches or more were common. The largest July rainfall total was at the NWS Du Quoin site with 8.88 inches.

July 2011 rainfall in Illinois
July 2011 rainfall in Illinois. Click to enlarge.

July 2011 rainfall departure for Illinois
July 2011 rainfall departure from average for Illinois. Click to enlarge.

Sixth Warmest July on Record for Illinois

It comes as no surprise that this July was one of the warmest on record. The statewide average temperature for Illinois was 80.1 °F. That is 4.3 °F above average and the 6th warmest on record (tied with 1955). Here is how the top six Julys look:

  1. 83.1 in 1936
  2. 81.7 in 1901
  3. 81.3 in 1934
  4. 80.4 in 1916
  5. 80.2 in 1921
  6. 80.1 in 2011 and 1955

While the daytime temperatures were impressive, it was the very warm nighttime temperatures that pushed this July into the top 10 list. Here in Champaign-Urbana, we were the 7th hottest July in terms of daytime high temperatures but we were the 2nd hottest July in terms of nighttime low temperatures. Why so hot, especially at night? The high humidity levels experienced in July prevented the nighttime temperatures from cooling off.
Looking at stations with records of at least 30 years, we had 168 broken and 71 tied daily record high low temperatures. Meanwhile we had only 28 broken and 24 tied record daily high temperatures.
At least 38 sites reported temperatures reaching the 100°F mark. The hottest temperature reported for July was 105°F at Dixon Springs on July  13 and Streator on July 25.

Does this July indicate climate change?

Below is the graph of July temperatures for Illinois from 1895 to present. While July 2011 was outstanding compared to recent decades, we have had other stretches of hot Julys. In my opinion, the most interesting feature is the dramatic rise in July temperatures in the 1920s and first half of the 1930s that maximized in 1936 before returning to values closer to the long-term average.
As the shading indicates, we were more often warmer than average (red shading) in the first half of the 20th century. We were more often cooler in the second half of the 20th century and in the early 21st century. Another thing to note is that 2009 was the coldest July on record for Illinois with an average of only 70.2°F and now this year with the 6th warmest.
At this point, this July does not indicate a pattern of hotter summers in July. The large year to year variability as well as the tendency for trends of up to 10 years to appear and disappear show just how hard it is to detect long-term (i.e., multi-decade) climate change in the Illinois records for summer.

July temperature for Illinois
July Temperature, Average for Illinois from 1895 to 2011. The arrow denotes 2011. The long term averages (1895-2010) is shown as a horizontal line in the middle of the chart. Five-year moving averages are plotted in comparison to the long-term average and shaded as red (above average) or blue (below average) curves. Click to enlarge. Source: Southern Climate Impacts Planning Program.

Dangerous Heat and Humidity in Illinois

The National Weather Service (NWS) has issued a variety of heat warnings and advisories for Illinois this week. The combination of temperatures in the upper 90s and high levels of humidity mean a greater risk of heat-related illnesses and death.
One measure that combines both the effects of temperature and humidity is the heat index. Explanations of the heat index can be found on Wikipedia and NWS. Below is a chart showing the heat index for a given temperature and relative humidity. If you like to do your own calculations, here is the NWS heat index calculator.
While the heat index incorporates relative humidity to give a better idea of what the temperature feels like, there are some important underlying assumptions. It assumes a person who is 5′ 7″, 147 lbs, walking at 3 mph, wearing long pants and a short-sleeve shirt, in the shade with a light breeze. It is estimated that working out in the sun would increase the heat index by 15°F.
Here are some resources to consider for monitoring the heat and what to do during the current heat wave:

HEAT INDEX
RELATIVE HUMIDITY (%)
Temp. 40 45 50 55 60 65 70 75 80 85 90 95 100
110 136
108 130 137
106 124 130 137
104 119 124 131 137
102 114 119 124 130 137
100 109 114 118 124 129 136
98 105 109 113 117 123 128 134
96 101 104 108 112 116 121 126 132
94 97 100 103 106 110 114 119 124 129 135
92 94 96 99 101 105 108 112 116 121 126 131
90 91 93 95 97 100 103 106 109 113 117 122 127 132
88 88 89 91 93 95 98 100 103 106 110 113 117 121
86 85 87 88 89 91 93 95 97 100 102 105 108 112
84 83 84 85 86 88 89 90 92 94 96 98 100 103
82 81 82 83 84 84 85 86 88 89 90 91 93 95
80 80 80 81 81 82 82 83 84 84 85 86 86 87
Category Heat Index Possible heat disorders for people in high risk groups
Extreme Danger 130° or higher Heat stroke or sunstroke likely.
Danger 105 – 129° Sunstroke, muscle cramps, and/or heat exhaustion likely. Heatstroke possible with prolonged exposure and/or physical activity.
Extreme Caution 90 – 105° Sunstroke, muscle cramps, and/or heat exhaustion possible with prolonged exposure and/or physical activity.
Caution 80 – 90° Fatigue possible with prolonged exposure and/or physical activity.