February On Track To Be Among The Coldest on Record for Illinois

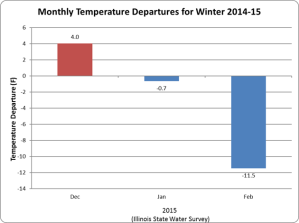
image004February 2015 is on track to being one of the coldest February’s on record for Illinois. Data through February 24 puts the statewide average at 19.4° F. This is 11.5°F below average and slightly colder than last February’s 19.4°F. Before February, this was shaping up to be a mild winter with near to above-average temperatures (see graph to the left, click to enlarge).

At this point, February 2015 is ranked as the 8th coldest on record, edging out 2014 (see table below). The NWS forecasts show that temperatures for the rest of February will be 15 to 20 degrees below average. Therefore it is possible that it could move up the ranks. I will post more on this at the end of the month.

Ten Coldest February’s in  Illinois

  1. 1978 (16.9°)
  2. 1936 (17.2°)
  3. 1979 (17.4°)
  4. 1905 (17.6°)
  5. 1895 (17.7°)
  6. 1899 (18.0°)
  7. 1902 (19.2°)
  8. 2015 (19.4°) ** as of February 24
  9. 2014 (19.5°)
  10. 1914 (20.6°)

Statewide records go back to 1895.

Chance of a White Christmas

I just heard Bing Crosby on the radio and it reminded me that it’s time to do the annual post on …

What are the historical chances of a White Christmas (defined as at least an inch of snow on the ground on Christmas Day)? The first map below the shows the odds across the state. It should come as no surprise that the highest odds are in northern Illinois.  In general, the odds are about 40-60 percent in the northern third of Illinois, 20-40 percent in central Illinois, and 0-20 percent in southern Illinois.

There can be large differences between nearby sites. Snowfall is notoriously difficult to measure with the potential for two nearby sites having different results due to exposure to the sun and the wind.

WC_Chance_8110

After a cold November, December has been much milder this year. The latest NWS 8-14 day forecast includes December 25 and continues to show Illinois with a good chance of warmer-than-average temperatures. And today there is not much snow in Illinois (map below). Stay tuned to your local forecast as we get closer.   Continue reading “Chance of a White Christmas”

October Cooler and Wetter Than Average So Far in Illinois

The statewide average temperature for October so far in Illinois is 56.5 degrees, 1.4 degrees below average. The statewide average precipitation for October so far is 2.5 inches.

Here is the map showing how the precipitation has fallen in Illinois and surrounding states. The heaviest amounts in Illinois were the 3 to 5 inches between Interstates 70 and 74. Amounts of 1 to 3 inches were common in the northern and southern thirds of the state. The largest total so far is 8.38 inches reported at Greenfield in Greene County

Most of Missouri has seen amounts of 3 to 6 inches or more as well as parts of Indiana and Michigan. It was a little drier in the Minnesota, Wisconsin, Iowa, Ohio and the rest of Indiana where amounts of 0.5 to 2 inches were common.
map_btd  Continue reading “October Cooler and Wetter Than Average So Far in Illinois”

Year to Date – Cool and Wet in Illinois

It is probably not shocking news to find out that the first 8 months of 2014 have been both cooler and wetter than average for Illinois.

The statewide average temperature for January-August was 50.8 degrees, 3.5 degrees below the 1981-2010 average and tied with 1924 as the fifth coolest on record.

The statewide average precipitation for January – August was 28.79 inches, 1.46 inches above average and the 34th wettest on record.

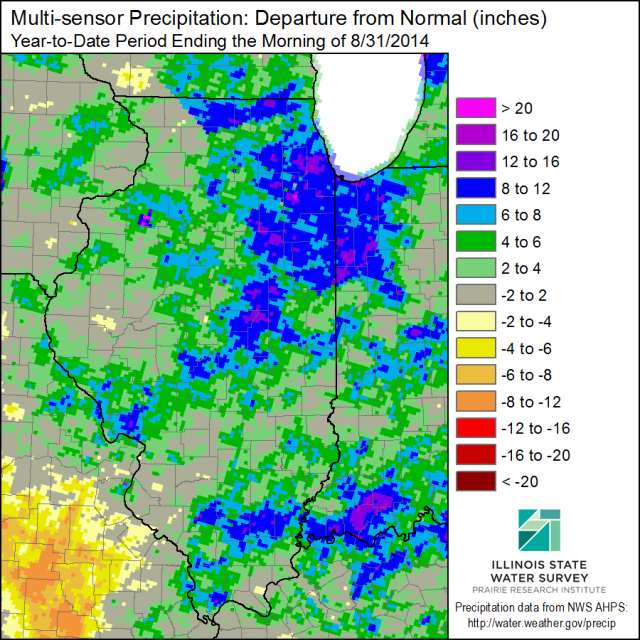
Here is what the precipitation departures look like through the end of August. Several areas in northeast and east-central Illinois have precipitation departures of 6 to 12 inches above average in the shades of blue, and a few areas with 12 to 16 inches above average. Areas in green are 2 to 6 inches above average. Only a few small areas in tan/beige are 2 to 4 inches below average.

IL-prcp-mpe-y2d-dev-20140831