Agricultural Impact of the Wet Growing Season in Illinois

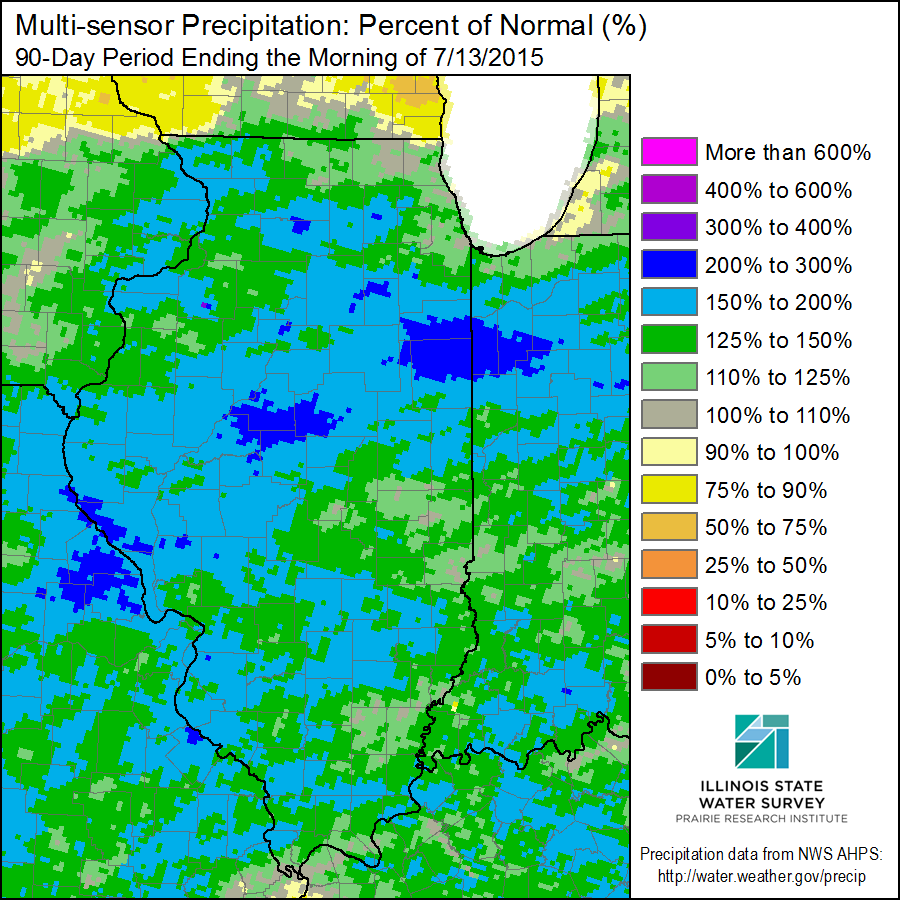
Here is the precipitation across Illinois for past 90 days as a percent of average. Click to enlarge.

After a record-setting June, as well as a wet May beforehand and a wet July so far, we are seeing the agricultural impacts of the wet growing season. Right now, the state-wide July precipitation in Illinois is at 3.1 inches. That is about 50% above the long-term average for this time in the month.

According to the USDA report yesterday, only 96% of the soybean crop in Illinois has been planted.

Meanwhile, the corn and soybeans already in the ground have struggled. For corn, 5% of the crop was rated “very poor” and another 11% rated “poor”. For soybeans, 7% of the crop was rated “very poor” and another 13% rated “poor”.

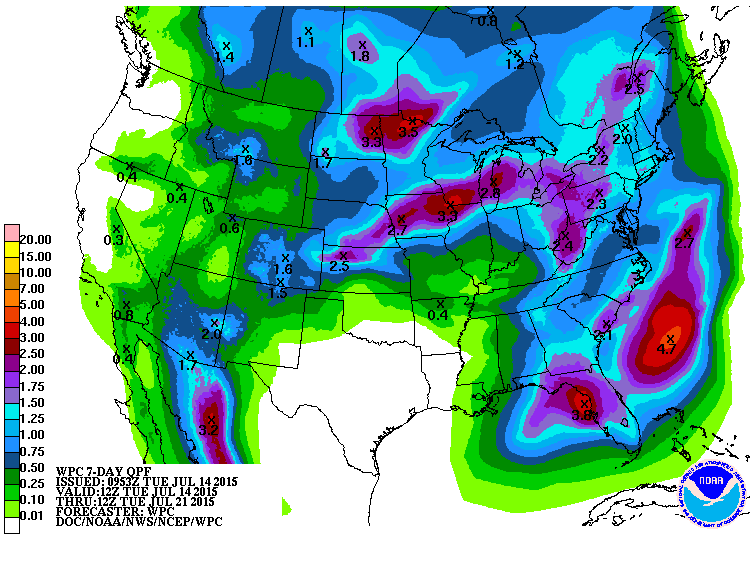
According to the National Weather Service, the potential for heavy rainfall remains – especially in northern Illinois. Rainfall amounts over the next 7 days could range between 1 to 3 inches in northern Illinois, 0.25 to 1 inch in central Illinois, and 0.25 inches or less in southern Illinois. Local amounts could vary widely from place to place due to the nature of the storms.
p168i
Click to enlarge.

2015 Versus 1993 in the Midwest

I have had several people say that all this summer feels like 1993. If you compare 2015 with 1993 in the maps below for June 1 – July 13, you can see that in 2015 the heavy rains were more concentrated in Missouri, Illinois and Indiana (shades of light blue and pink, indicating between 12.5 and 20 inches of rain). In fact, Illinois has been wetter in 2015 than in 1993 during the last 6 weeks.

The rains of 2015 have lead to moderate to major flooding on the Illinois River, as well as moderate flooding on the Mississippi River from Quincy southward according to the National Weather Service.

On the other hand, in 1993 the heaviest rains were shifted northward and westward (second map) and Missouri and Iowa took the brunt of the heavy rains. That northward and westward shift in the heavy rains resulted in major flooding impacts on the Missouri and Mississippi Rivers.  Continue reading “2015 Versus 1993 in the Midwest”

Cool Start to August with Rain in Southern and Western Illinois

The statewide average temperature for August so far is 72 degrees, 2 degrees below average. This follows on the heels of the cool July. The NWS forecast show that the mild temperatures will continue this upcoming week with highs in the upper 70s and low 80s in northern Illinois to the low to mid 80s in central and southern Illinois. The 6-10 and 8-14 day forecasts that extend out to August 21 point towards a continuation of cooler-than-average conditions.

All in all, it should be great weather for the Illinois State Fair. I can remember many years of the State Fair being hot and humid with your choice of either dust or mud. It’s a wonder the butter cow did not melt.

The map of observed precipitation below from the NWS shows that rainfall has been widespread and fairly heavy in western and southern Illinois with amounts ranging from 1 inch (green) to 5 inches (red). It is lighter and more variable in northern and eastern Illinois, ranging from 0.1 inches (light blue) to 2 inches (dark green). Much of that heavy rain to the east of St. Louis fell in a part of Illinois that was dry in July.

august-mpe

Heavy Rains of April 18-19, 2013

Northern and central Illinois saw widespread heavy rains on April 18-19, 2013. As a result, widespread flooding occurred first at the local level and then along major rivers by the weekend. Last year we had the drought; this year we have what I’m calling the “anti-drought”.
Below is the multi-sensor precipitation map for the 7-day period ending April 19, 2013. This map is based on radar-estimated precipitation and calibrated using available raingauges. Some of the heaviest rains fell north of a line between Quincy and Kankakee. Areas in purple reported between 6 and 8 inches, while the areas in the two shades of red were between 4 and 6 inches. Areas to the south of Interstate 70 escaped the heavier rains.
The second map is the precipitation situation for the year to date, expressed as a percent of “normal” or long-term average. The entire state is above average with the percentages getting larger (wetter) northward. In general, I would characterize the southern third of the state as being 110 to 150 percent of average so far. The central third of Illinois is between 150 and 200 percent of average and the northern third is between 200 and 300 percent of average.
The last figure is a photo that I took on my commercial flight from Chicago to Champaign on Thursday afternoon, just after the worst of the rain had fallen. It is not the best photo in the world because it was gloomy, foggy, and the flight was rough. But it does show how saturated the fields were at this point.
IL-prcp-mpe-007-tot-20130419
IL-prcp-mpe-y2d-pct-20130419

photo
Picture of flooded farm fields somewhere between Chicago and Champaign Illinois on Thursday afternoon (April 18). It’s not the best picture in the world , but I took this out the window of the airplane while flying through moderate turbulence. You can see the water standing in fields and how small creeks were transformed into rivers. Click to enlarge.