As of May 8, 2013, the severe weather statistics for Illinois this year are relatively low (see first map). There have been 2 tornado reports (red dots), 25 hail reports (green dots), and 62 wind damage reports (blue dots). By this point last year, we had 22 tornadoes including the deadly February 29 tornado at Harrisburg, IL, that killed 8 people.
Harold Brooks of the NWS has an interesting post on the current “tornado drought” in the US for the period from May 2012 to April 2013. He says,
The 12-month period from May 2012 to April 2013 was remarkable for the absence of tornado activity and tornado impacts in the United States.
The number of tornadoes in the US was the lowest on record (197) and the number of deaths (7) was the second lowest during this 12-month period. Brooks’ looked at tornadoes that were rated EF-1 or greater. Those tornadoes tend to be better documented over time than the relatively weak EF-0 events. Those records go back to 1954. The number of tornado deaths were based on records going back to 1875.
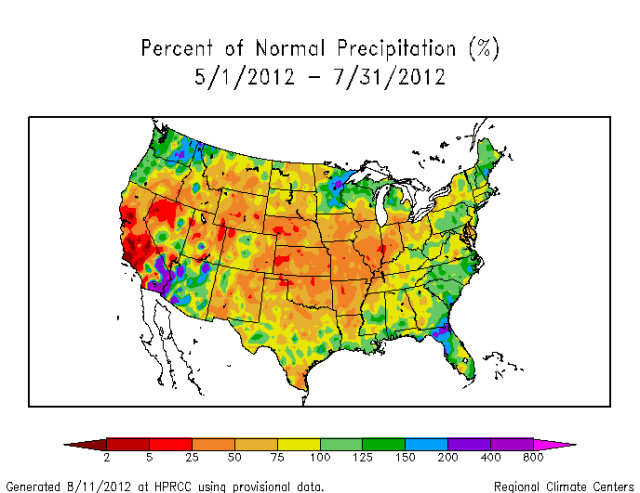
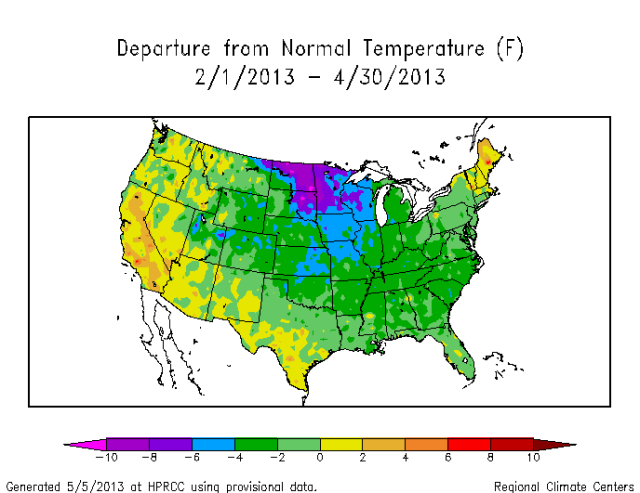
A possible explanation for the low numbers during this May 2012 to April 2013 period was that much of the central US was in drought in 2012 (see second map). This was followed by a late, cold spring in 2013 (see third map). Both of these conditions seem to produce fewer severe thunderstorms, at least in Illinois.
There has been lots of discussion about whether the low numbers this year or the high numbers in 2011 either prove or disprove climate change. It is hard to track historical climate changes in the tornado reports in Illinois and the US because of major changes in how the data were collected over time. Furthermore, climate models used for understanding future climate change are not designed to simulate severe weather at such a small scale. As a result, the Intergovernmental Panel on Climate Change last year stated there was “low confidence” in finding historical trends or making projections of possible future tornado activity (IPCC, 2012 pdf). You can find a short discussion on historical tornado trends in Illinois on my website.
While these are interesting statistics, it’s important to keep in mind that things can change in a hurry. All it takes is one day with the right conditions, especially now that we are finally getting warmer, and Illinois could be faced with another tornado outbreak. Stay alert!


