Today I had a reporter ask if the recent rains and flooding in Illinois will benefit the low lake levels of Lake Michigan. It has helped.
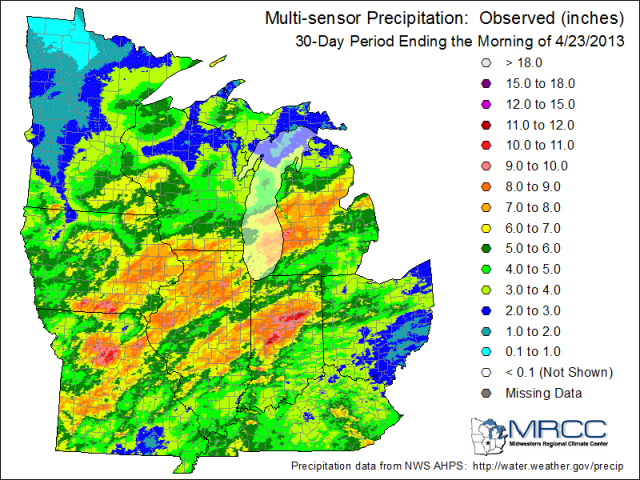
First of all, the Illinois part of the Lake Michigan basin is relatively small and extends only a few miles inland (see first figure below). As a result, most of the rain that fell in Illinois in recent weeks ended up going down the Illinois River instead. However, as the 30-day multi-sensor precipitation map (second figure) for the Midwest shows, the heavy rains continued over the southern third of Lake Michigan as well as into the Michigan side of the Lake Michigan basin. Amounts in the those areas were as high as 6 to 9 inches in the last 30 days which is well above average.
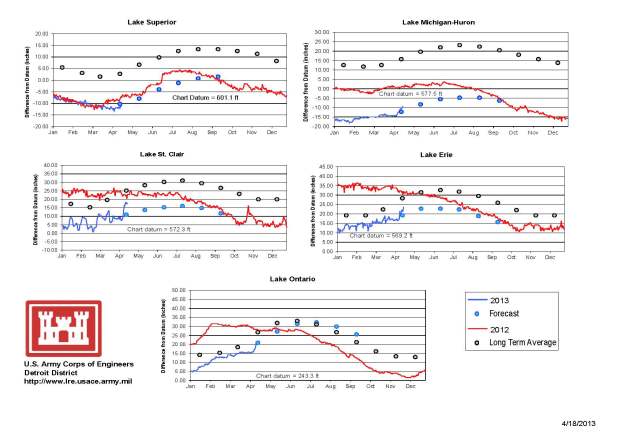
As a result, we have seen water levels rise on Lake Michigan in April. The third figure below is from the US Army Corps of Engineers Detroit Office showing the status of all five lakes lat week. In the upper right hand corner is the plot for Lake Michigan-Huron. The blue line is this year, and the red line is last year. The blue dots are the forecast and the grey dots are the long-term average. You can see that the Lake Michigan lake level has risen by five inches since the beginning of April. You may want to click on the image to get the larger view or look at the original report, in a higher resolution pdf file, here.
The current forecast for Lake Michigan by the US Army Corps of Engineers, released in early April, suggests that water levels will remain below-average for the next six months and will likely be just a few inches above the record levels.


New Climate Prediction Center Outlooks
On February 20, the NWS Climate Prediction Center released their new outlooks for March and beyond. Below are the maps for March, spring (March to May), and summer (June to August).
The overall theme for Illinois is an increased chance of above-average temperatures through August. We have an increased chance of above-average precipitation in the March-May period, followed by equal chances in the June-August period. If it pans out, above-average precipitation for this spring should help with low water levels on both the Great Lakes and Mississippi River as well as alleviate drought concerns in northern Illinois.
If you are wondering when was the last time we had a spring that was both warmer and wetter than average, you do not have to look very far. The springs of 2004, 2006, 2009, 2010, and 2011 all qualified as having both above average on precipitation and temperature. In fact, our spring temperatures in Illinois have been at or above average in all but 2 years since 1998 (last figure).


Record Low Pressure on Great Lakes Storm
According to the National Weather Service
New record set today for the lowest pressure in a non-tropical storm in the mainland U.S. The massive storm system barreling across the central U.S. had a minimum central pressure of 28.24″ or 956 mb (equivalent to the minimum pressure of a Category 3 hurricane). This breaks the old record of 28.28″ (958 mb), set on Jan. 26, 1978, during the Blizzard of 1978 (aka the Cleveland Superbomb). This is also lower than the March 1993 Superstorm (aka “The Storm of the Century”), or the “Witch of November” storm that sank the Edmund Fitzgerald in 1975, or even the Columbus Day Storm of Oct. 1962.
Strong Storm to Hit Great Lakes
The National Weather Service has predicted a strong low pressure system, or cyclone, to hit the Great Lakes on Tuesday and Wednesday. The central pressure could be as low as 959 millibars (mb) (28.35 in), and associated with strong winds and significant wave heights on the Great Lakes.

The Great Lakes are no stranger to storms like this. The most notorious have hit in November and have included high winds, heavy snow, and treacherous waves.
- The Great Lakes Storm of 1913 – occurred on November 6-11, 1913 and sank 19 ships and killed 250 people. The lowest pressure was 968 mb (28.35 in) with winds up to 90 mph and 35 foot waves;
- The Armistice Day Storm of 1940 – occurred on November 10-12, 1940, and sank 5 ships and killed 154 people (many were duck hunters caught unprepared by the drastic change in weather). The lowest pressure was 967 mb (28.55 in) with 80 mph winds.
- Edmund Fitzgerald Storm of 1975 – occurred on November 10-11, 1975, led to sinking of the Edmund Fitzgerald with the loss of 29 men. The lowest pressure was 976 mb with winds in the 60-70 mph range with waves heights possibly up to 25 feet.
Two books on the 1913 storm are Freshwater Fury (Barcus 1960) and White Hurricane (Brown 2004). The Wikipedia article is here. The weather conditions are described here. If you do a search on “Great Lakes 1913 Storm” you will find many web links.
For the Armistice Day Storm of 1940, I am not aware of any specific books. I have seen some magazine articles on it over the years. The Wikipedia article is found here. Minnesota Public Radio gives a detailed account of the human toll here. This storm was different from the 1913 storm because many of the deaths occurred on land.
The Edmund Fitzgerald Storm of 1975 is probably the most widely known outside of the Great Lakes region. The loss of life was limited to the sinking of the Edmund Fitzgerald. Quite a few books and web sites are devoted to this storm. Here is a journal article that details the weather conditions of that storm.

