Corn and Soybean Conditions in Illinois Are Not as Good as Last Two Years

According to the USDA, corn and soybean conditions in Illinois are not as good as the last two years.

The USDA NASS site has lots of interesting agricultural data, if you know where to look. One of the great reports they put out every week are the crop conditions in graphical form. Just click on a state and go.

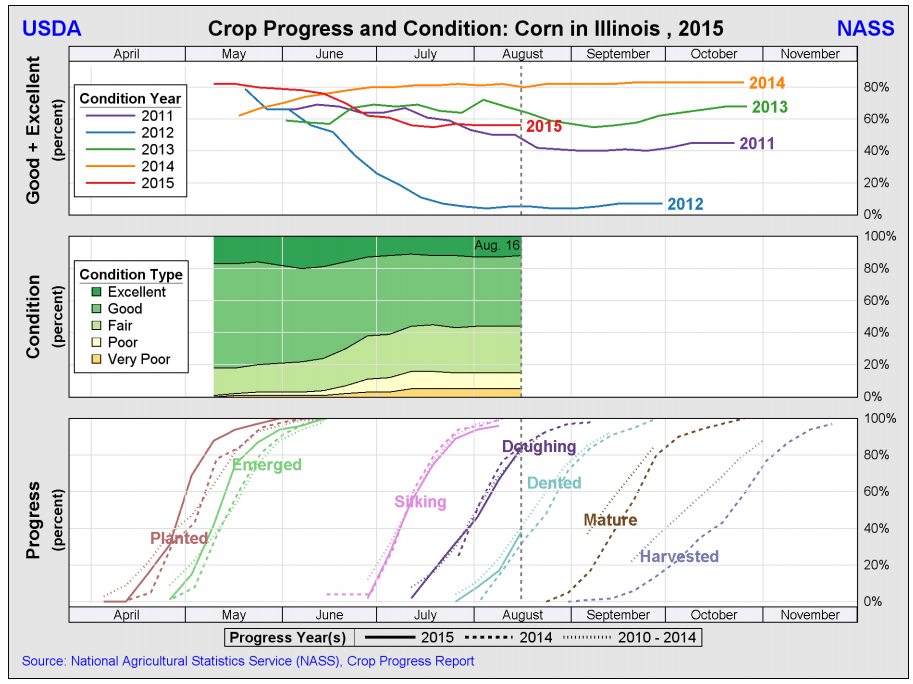
In this first graph, you can see the corn crop conditions compared to earlier years. The percent in good to excellent for 2015 is less than 2013 and 2014. It is a little better than 2011, which was hot and dry in places. It was better than 2012 when we had the full blown drought. The second panel shows you the crop conditions in all categories throughout the 2015 growing season. And finally you can see the crop stages this year, compared to last year and the 5-year average.

corn Continue reading “Corn and Soybean Conditions in Illinois Are Not as Good as Last Two Years”

USDA Report Reflects Impact of Drought in Illinois

Last week the Illinois office of the National Agriculture Statistics Service released their report on crop yields in Illinois. The full report can be found here.
As expected, the Illinois corn yield for 2012 was only 105 bushels per acre, 52 bushels below last year. They noted that this was the lowest yield since 1988, when the average yield was only 73 bushels per acres. Because of the severe conditions of the corn crop, almost twice as many acres were harvested for silage in 2012 than in 2011.
Illinois soybean yield for 2012 was 43.0 bushels per acre, down 4.5 bushels from 2011. This was the lowest soybean yield since 2003, when the average yield was only 37.0 bushels per acre. While too late to do much good for corn, rains in the second half of August and the remains of Hurricane Isaac over Labor Day weekend may have provided some benefit to soybeans.
The one bright spot in the Illinois report was winter wheat production. The yield in 2012 was 63 bushels per acre, up 2 bushels from 2011. However, only 660,000 acres were seeded in the fall of 2011, which is down 140,000 acres from the previous fall. I suspect the decline was due in part to the already dry conditions experience in southern Illinois – the primary production area of the state.

Latest Analysis on the Impacts of Drought on U.S. Agriculture

The USDA has produced some interesting slides for the World Agricultural Outlook Board, showing the current drought overlaid on production areas. The first two are about the U.S. corn production areas, then the soybean areas, and finally the cattle areas. Each pair of slides shows a map of the overlay, and a time series of the area affected by drought.
By July 24, about 89 percent of the corn production area was in drought. That percentage has been climbing steadily since early June. It’s the same story with 88 percent of the soybean production area and 73 percent of the cattle production area in drought.

Click to enlarge.

Click to enlarge.

Click to enlarge.

Click to enlarge.

Click to enlarge.

Click to enlarge.

Frost Damage to Corn

There is an excellent article in the integrated pest management Bulletin at the University of Illinois by Emerson Nafziger about the damage of frost to corn this April and it’s impact on yield. You can read the full article at http://bulletin.ipm.illinois.edu/article.php?id=1619 

Here are the low temperatures reported last week, sorted from coldest to not so coldest. 

Station Name Low Temp(°F) Month/Day
PAXTON 20 11-Apr
CHAMPAIGN 9 SW 21 11-Apr
PAW PAW  23 11-Apr
JERSEYVILLE 2 SW 23 17-Apr
MT CARROLL 24 11-Apr
SIDELL 5 NW  24 11-Apr
WATSEKA 2 NW 24 11-Apr
LISLE-MORTON ARBORETUM 25 11-Apr
SHABBONA 5 NNE 25 10-Apr
ALTONA 25 11-Apr
MONMOUTH 4 NW  25 11-Apr
NORMAL 4NE 25 11-Apr
CONGERVILLE 2 NW 25 11-Apr
NORMAL 4NE 25 11-Apr
PERRY 6 NW 25 12-Apr
GALENA 26 11-Apr
STOCKTON 3 NNE 26 11-Apr
MARSEILLES LOCK  26 11-Apr
LA HARPE 26 11-Apr
PRINCEVILLE 2W 26 11-Apr
DWIGHT 26 11-Apr
HOOPESTON 1 NE 26 11-Apr
NEOGA 4NW  26 11-Apr
SULLIVAN 26 11-Apr
ELIZABETH  27 11-Apr
KEWANEE 1 E  27 12-Apr
ROCKFORD GTR ROCKFORD AP 27 11-Apr
DE KALB  27 11-Apr
MCHENRY STRATTON L&D 27 11-Apr
MUNDELEIN 4 WSW  27 11-Apr
BENTLEY  27 12-Apr
GALESBURG  27 11-Apr
PRAIRIE CITY 2S  27 11-Apr
CHENOA 27 11-Apr
DANVILLE 27 11-Apr
EFFINGHAM  27 11-Apr
NEWTON 27 11-Apr
PARIS WTR WKS  27 11-Apr
TUSCOLA  27 11-Apr
WINDSOR  27 12-Apr
FREEPORT WWP 28 11-Apr
HENNEPIN 28 12-Apr
MOLINE QUAD CITY INTL AP 28 12-Apr
ROCHELLE 28 11-Apr
ROCHELLE 28 11-Apr
BARRINGTON 3 SW  28 11-Apr
ELGIN  28 11-Apr
MARENGO  28 11-Apr
MORRIS 28 11-Apr
KNOXVILLE  28 11-Apr
BLOOMINGTON 5W 28 11-Apr
DECATUR  28 11-Apr
MINONK 28 11-Apr
OGDEN  28 12-Apr
PONTIAC  28 11-Apr
CARLINVILLE  28 11-Apr
MORRISONVILLE  28 11-Apr
SPRINGFIELD CAPITAL AP 28 11-Apr
CHARLESTON 28 11-Apr
PALESTINE 2W 28 11-Apr
RAMSEY 28 11-Apr
ROBINSON 28 11-Apr
SHELBYVILLE DAM  28 11-Apr
ALEDO  29 11-Apr
CHICAGO BOTANICAL GARDEN 29 11-Apr
OTTAWA 29 11-Apr
ROMEOVILLE LEWIS UNIV AP 29 11-Apr
QUINCY RGNL AP 29 11-Apr
RUSHVILLE  29 11-Apr
URBANA 29 11-Apr
GRIGGSVILLE  29 13-Apr
PITTSFIELD #2  29 12-Apr
SPRINGFIELD #2 29 11-Apr
WHITE HALL 1 E 29 12-Apr
WINCHESTER 29 11-Apr
HIDALGO 3SW  29 11-Apr
PANA 29 11-Apr
MT VERNON 3 NE 29 12-A
pr
GENESEO  30 11-Apr
NEW BOSTON DAM 17  30 13-Apr
AURORA 30 11-Apr
JOLIET BRANDON RD DM 30 11-Apr
LITTLE RED SCHOOL HSE  30 11-Apr
PARK FOREST  30 11-Apr
PEORIA GTR PEORIA AP 30 11-Apr
FISHER 30 11-Apr
RANTOUL  30 11-Apr
JACKSONVILLE 2 E 30 12-Apr
OLNEY 2S 30 11-Apr
TRIMBLE 1E 30 11-Apr
VANDALIA 30 11-Apr
CARBONDALE SEWAGE PLT  30 12-Apr
SPARTA 30 11-Apr
FAIRFIELD RADIO WFIW 30 12-Apr
ILLINOIS CITY DAM 16 31 12-Apr
CHANNAHON DRESDEN ISLAND 31 12-Apr
CHICAGO MIDWAY AP  31 11-Apr
CHICAGO MIDWAY AP 3 SW 31 11-Apr
KANKAKEE METRO WWTP  31 11-Apr
FLORA  31 12-Apr
IUKA 31 11-Apr
BELLEVILLE SIU RSRCH 31 12-Apr
DU QUOIN 4 SE  31 12-Apr
ROCK ISLAND L&D 15 32 11-Apr
CHICAGO OHARE INTL AP  32 11-Apr
QUINCY DAM 21  32 12-Apr
STREATOR 32 11-Apr
JACKSONVILLE 2 32 11-Apr
CARLYLE RSVR 32 11-Apr
KASKASKIA RIV NAV LO 32 12-Apr
LEBANON  32 12-Apr
SMITHLAND L&D  32 12-Apr
MORRISON 33 17-Apr
GLADSTONE DAM 18 33 11-Apr
BIRDS 2E 33 11-Apr
LAWRENCEVILLE  33 11-Apr
SALEM  33 11-Apr
NASHVILLE 1 E  33 12-Apr
CAIRO 3 N  34 12-Apr
GRAND CHAIN DAM 53 34 12-Apr
BROOKPORT DAM 52 34 12-Apr
ALTON MELVIN PRICE 41 10-Apr
GRAYVILLE  44 10-Apr