
For the period from January through October, the statewide temperature for Illinois was 52.5 degrees, a full 3 degrees below the long-term average of 1981-2010 and the sixth coolest year to date on record with those records going back to 1895. The five colder years were 1904, 1917, 1979, 1912, and 1978.
Of course, you may ask how can we be so cold during a phase of global warming. There are two answers to that. One is that most of the cold weather for 2014 was confined to the central US. While we were cold in the central US, the western US was much warmer than average.
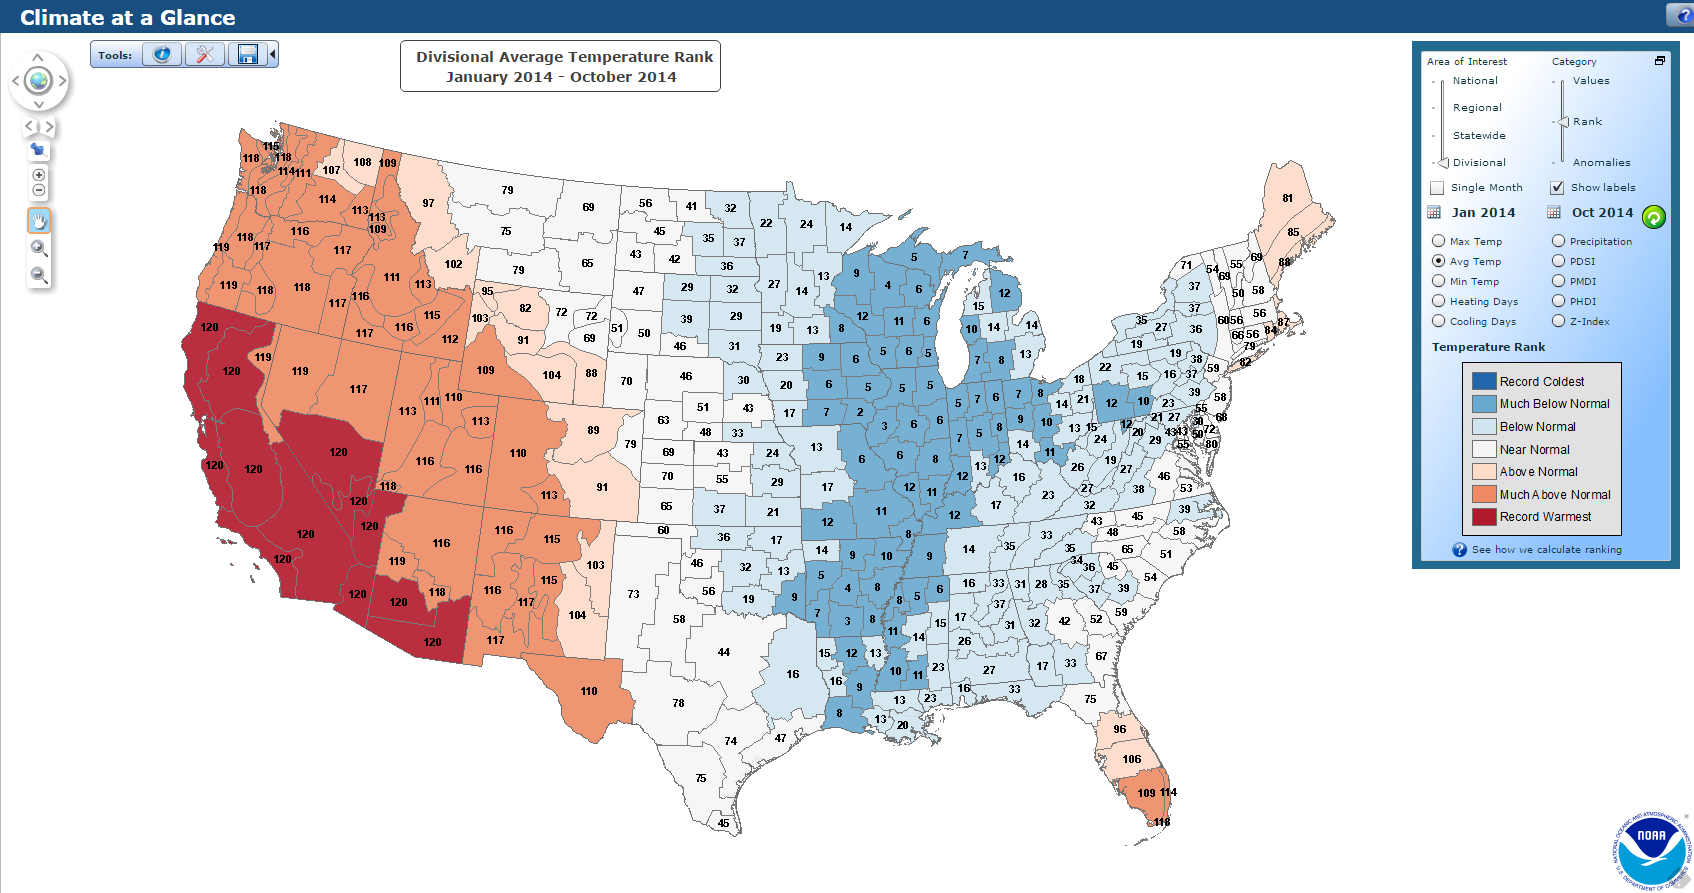
… and the central US may go down as one of the few cold spots on average, of any place on earth for 2014 so far (see the blue patch on the global map below).

In addition, while 2014 has been colder than average in Illinois (last dot on the time series plot below), it has been the exception to the rule since the early 1980’s.

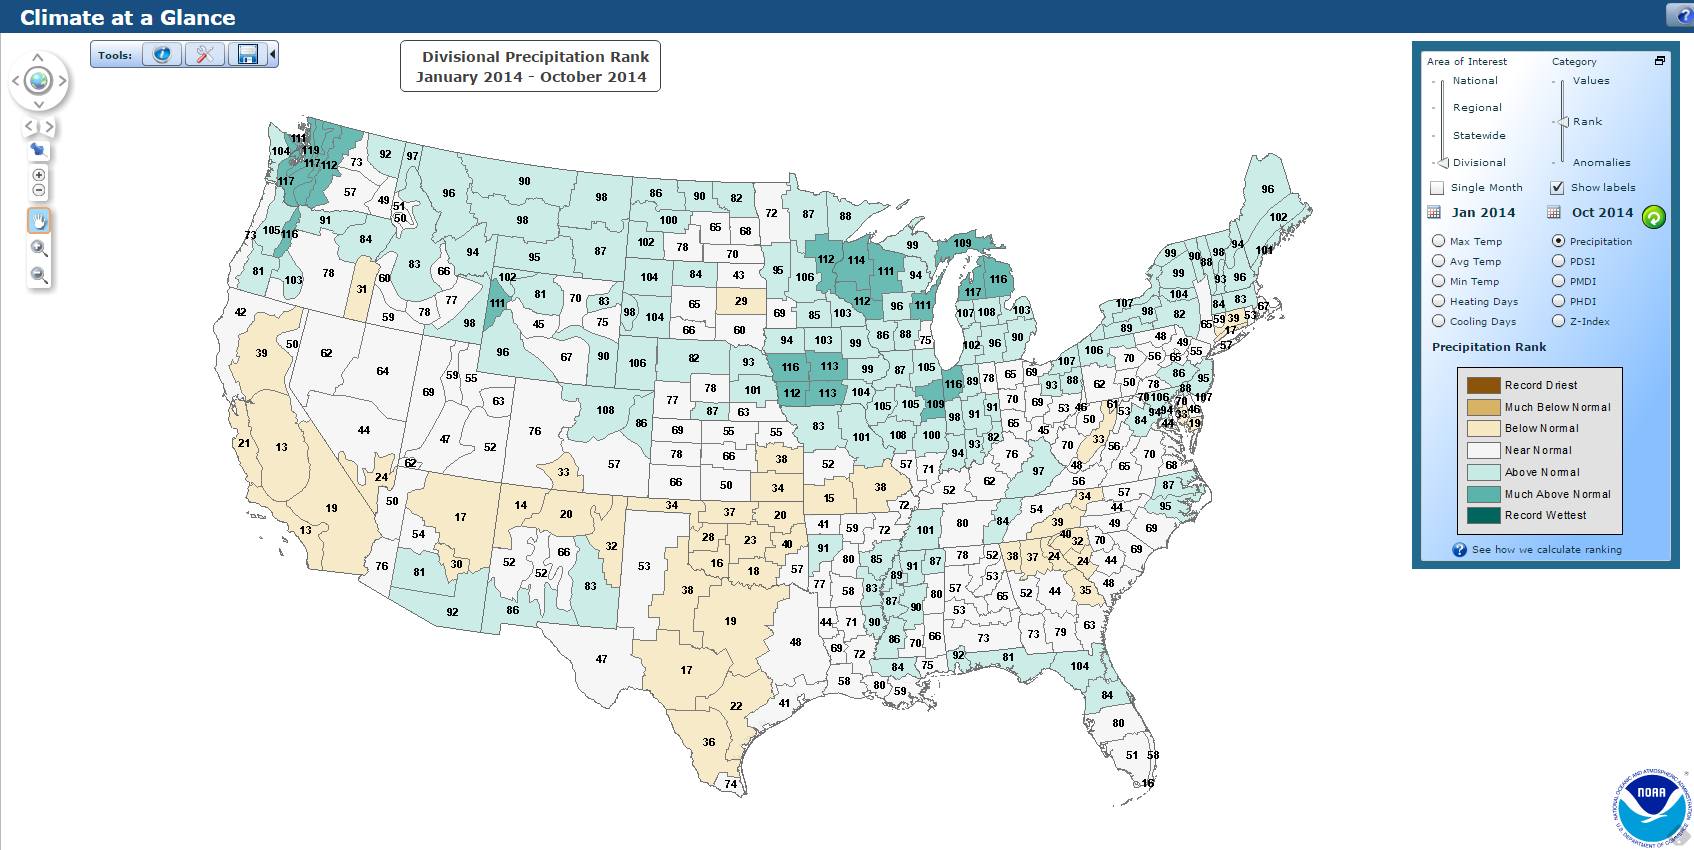
PRECIPITATION
For the same period, the statewide precipitation was 37.47 inches, 3.67 inches above average and the 19th wettest on record. It was a very wet year so far across much of the rest of the Midwest/Great Lakes region, except for dryness in KS and MO.
Below are the monthly temperature and precipitation departures by month for Illinois in 2014. Below the bar plots are the data used in the plots.
For temperature, January, February, and March were exceptionally cold, as was July. April, May, June, August, and October were much closer to average.
For precipitation, we had an interesting bipolar pattern of a dry month followed by a wet month that continued all the way to August before things became consistently wet through October.
*These numbers are preliminary and may change a little as more data comes in.


| Year | Month | Temperature | Normal | Depart |
| 2014 | Jan | 19.3 | 26.4 | -7.1 |
| 2014 | Feb | 19.4 | 30.9 | -11.5 |
| 2014 | Mar | 34.4 | 41.3 | -6.9 |
| 2014 | Apr | 52.4 | 52.6 | -0.2 |
| 2014 | May | 63.6 | 62.7 | 0.9 |
| 2014 | Jun | 73.0 | 71.9 | 1.1 |
| 2014 | Jul | 70.3 | 75.4 | -5.1 |
| 2014 | Aug | 73.7 | 73.6 | 0.1 |
| 2014 | Sep | 64.7 | 66.2 | -1.5 |
| 2014 | Oct | 54.4 | 54.4 | 0.0 |
| 2014 | Nov | 42.5 | ||
| 2014 | Dec | 29.9 | ||
| Year | Month | Precipitation | Normal | Depart |
| 2014 | Jan | 1.72 | 2.07 | -0.35 |
| 2014 | Feb | 2.22 | 2.06 | 0.16 |
| 2014 | Mar | 1.46 | 2.96 | -1.50 |
| 2014 | Apr | 5.15 | 3.78 | 1.37 |
| 2014 | May | 3.29 | 4.60 | -1.31 |
| 2014 | Jun | 6.77 | 4.21 | 2.56 |
| 2014 | Jul | 3.30 | 4.08 | -0.78 |
| 2014 | Aug | 5.20 | 3.59 | 1.61 |
| 2014 | Sep | 4.08 | 3.23 | 0.85 |
| 2014 | Oct | 4.28 | 3.24 | 1.04 |
| 2014 | Nov | 3.47 | ||
| 2014 | Dec | 2.69 |