Volcanoes and Climate in Illinois

When I give talks on climate and climate change, I often get questions about volcanoes and their impact on our climate. The Washington Post had a recent article on the subject, mentioning the famous eruption of Tambora in 1815, which in 1816 led to the year without a summer in the eastern US. It probably had impacts on Illinois but we had no widespread observations in place at the time.

http://www.washingtonpost.com/blogs/capital-weather-gang/wp/2015/04/24/the-epic-volcano-eruption-that-led-to-the-year-without-a-summer/

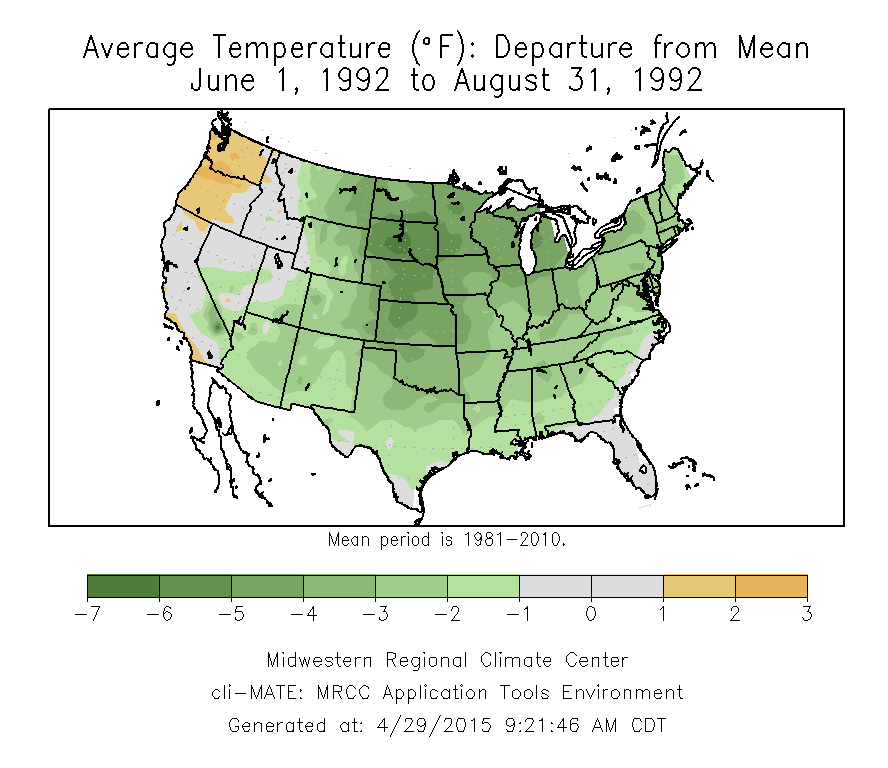
The one I remember the best was Mount Pinatubo. The following summer after that eruption was exceptionally cool across the US and around the world.

summer1992
Summer 1992 temperature departures from average for the lower 48 states. Shades of green indicate level of coolness. Click to enlarge.

Continue reading “Volcanoes and Climate in Illinois”

El Nino and the Midwest

NOAA has released a new 2-page fact sheet on El Niño and the Midwest (links below). Several people in the Midwest had input into this, including myself. El Niño typically results in warmer and drier than average winters. Confidence in these patterns is higher during stronger El Niño events.

Right now the NOAA Climate Prediction Center states that El Niño is favored to begin in the next 1-2 months and last into spring of 2015. The current thinking is that the odds are 2-in-3 in favor of it arriving and that the event will likely remain weak throughout its duration.

PDF version: EN-MW-Sep2014

Online version:

[scribd id=242836832 key=key-2ql4MIpJSjgpfv25L5Zd mode=scroll]

Wet August Wraps Up Cool, Wet Summer in Illinois

Highlights: The 12th wettest August in Illinois finishes out the 10th wettest summer on record. While August was slightly warmer than average, the summer was cooler than average. Here are the statistics.

August Statistics

The statewide average precipitation for August was 5.18 inches, 1.59 inches above average and the 12th wettest on record. The wettest area of the state was Cook County. The largest monthly total was from a CoCoRaHS site (IL-CK-100) in Cicero with 10.20 inches of precipitation.

This first map shows several areas across the state with amounts of 7 to 10 inches (oranges and reds), according to radar estimates. There were a few areas in the northwest and east-central Illinois with only 2 to 3 inches. The second map shows the departures from average, showing the many areas with 2 to 8 inches above average for the month.

IL-prcp-mpe-m2d-tot-20140901


Continue reading “Wet August Wraps Up Cool, Wet Summer in Illinois”

Tie for Coolest July on Record for Illinois

The statewide average temperature for July was 70.3 degrees in Illinois, which ties the record cool July of 70.3 degrees set back in 2009 and 5 degrees below average.

Below is the plot of July temperatures for Illinois since 1895. The green dots are the actual temperature for each year, while the red and blue shading indicate periods of warmer or cooler temperatures. July 1936 (82.8 degrees) is the warmest July on record, followed closely by July 2012 (81.8 degrees). In the bottom right hand corner, are July 2009 and 2014. So in six years, we have experienced the 2nd warmest and twice the coldest July on record.

As this plot indicates, the observed range in July monthly temperatures in Illinois is 12.5 degrees. On another note, the July 2014 average temperature is based on preliminary data so it is very likely that we will break the tie with 2009 as more data arrives.

Cold-july
Click to enlarge. Map produced by NOAA funded project http://www.southernclimate.org/products/trends.php

Continue reading “Tie for Coolest July on Record for Illinois”