The recent rains and associated flooding in the Chicago area are reflecting the long-term pattern of wetter conditions in the region. Here are a few samples of that pattern.
First of all, northeast Illinois (Cook and several surrounding counties – see map below) has experienced a shift in precipitation over the last 120 years. This plot shows the amounts for each year as green dots, and an 11-year running average showing longer periods of dry conditions (brown) and wet conditions (green). There is a pretty remarkable shift from a drier climate between 1895 and 1965 with lots of brown, towards a wetter climate from 1966 to present where green dominates.
If you compare the average annual precipitation between the two periods, you get 32.9 inches for the earlier period and 36.8 inches for the later period. That is a 3.9 inch increase, or about 12 percent.
If you look at the 10 wettest years in the record, 8 out of the 10 came after the shift in 1965. The two exceptions were 1902 at #1 and 1954 at #10.
| Rank | Year | Precipitation |
| 1 | 1902 | 48.02 |
| 2 | 1972 | 46.68 |
| 3 | 2008 | 45.95 |
| 4 | 1990 | 45.66 |
| 5 | 2009 | 45.40 |
| 6 | 1993 | 44.34 |
| 7 | 2011 | 43.12 |
| 8 | 1982 | 42.77 |
| 9 | 1970 | 42.76 |
| 10 | 1954 | 41.54 |
Of course, we have still experienced drought conditions in this later wet period, as noted in 2005 and 2012. However, the wetter years far outnumber the dry years since 1965. BTW, this pattern is not unique. I have seen this across the state.

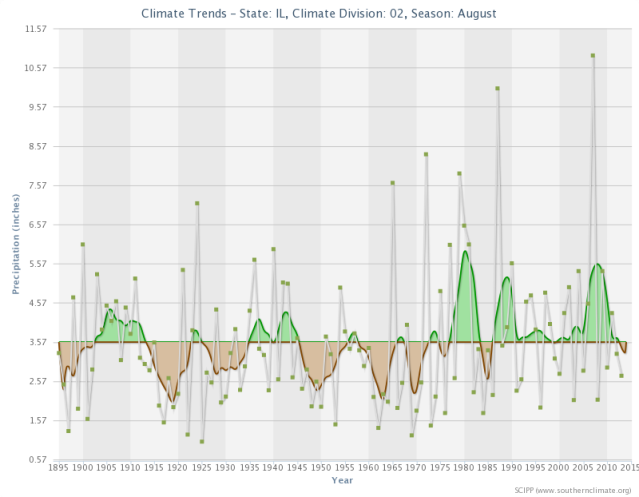
Here is the same plot for northeast Illinois for just the month of August. The green shading comes in a little later, showing generally wetter conditions since the 1980s. What is startling is the number of very wet Augusts in the last 50 years. The two wettest were 1987 with 10.04 inches and 2007 with 10.88 inches, which is more than double the long-term average.
As this plots show, the issue is not just a shift towards a wetter period over time but a shift towards wetter extremes as well.
As of August 27, 2014, the northeast region is at 5.4 inches, 1.83 inches above average.

Here is the region used in this discussion (aka Climate Division 2). Climate divisions are regions of roughly similar climate. The advantages of a regional average are no missing data and increased statistical confidence in the resulting values. You can read more about them here.


