First Half of March – Cold and Dry

Winter’s grip on Illinois is slowly releasing. However, we remain cold and dry for March. The statewide average temperature for March 1-16, 2014, was 30.3 degrees, which is almost 8 degrees below average. The good news is that the average, or normal, temperatures are climbing rapidly through the month. As a result, being 8 degrees below average in mid-March is still warmer than this winter. The NWS Climate Prediction Center 6-10 and 8-14 day forecasts show the below-average temperatures to continue through the end of March.

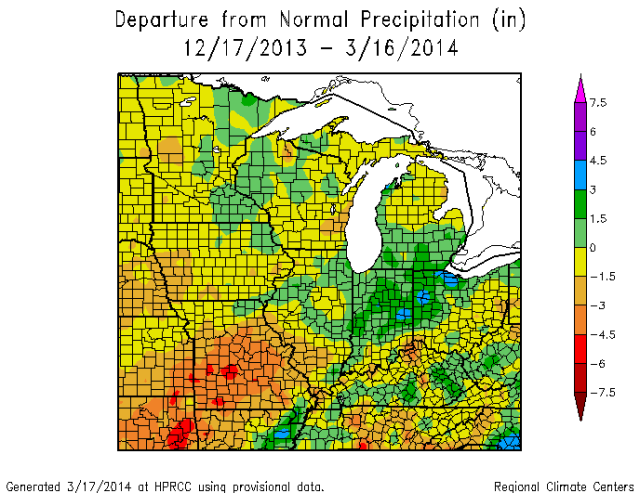
Besides the cooler temperatures, another concern at this point is the below-average precipitation (in shades of yellow and orange) for March so far. This is true not only across Illinois but much of the Midwest.

MonthPDeptMRCC
March Precipitation Departure from Average (inches). Click to enlarge.

Below are the 90-day precipitation departures from average. Above-average precipitation (shaded in green) can be found in IL, IN, OH, and MI, due for the most part to our generous snows and a few rain events. However, parts of southeastern IL are 1.5 to 3 inches below average. This is part of a larger area of dryness covering Missouri and parts of KS, OK, and AR. Of course this pattern could change quickly as we get out of winter and into spring. A few good spring rains could erase most of this deficit. In the meantime, we will be watching this area closely.

90dPDeptMRCC

February Seventh Coldest on Record

feb2014-floodedfield
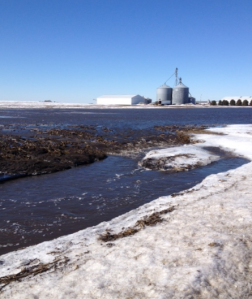
Flooded farm field in east-central Illinois after a period of snowmelt and rainfall in the third week of February, 2014.

Based on preliminary data, the Illinois statewide temperature for February was 18.7 degrees. That was 12.1 degrees below the long-term average and the seventh coldest February on record. No surprise there.

The statewide average temperature for the three core winter months of December, January, and February was 20.8 degrees. That was 8.2 degrees below average and the fourth coldest December-February period on record. Incidentally, it is in a 3-way tie with 1917-18 and 1976-77. The coldest winter was 1977-78 at 19.6 degrees. The winter of 1978-79 was in second place at 19.9 degrees. Overall, this winter was comparable to those in the late 1970s.

Below is the table of the ten coldest February’s on record for Illinois. It’s really hard to beat those cold February’s in the late 1970s. The 1981-2010 statewide average is 30.8 degrees.

Rank Year Avg.
1 1978 16.9
2 1979 17.5
3 1936 17.7
4 1905 17.8
5 1895 18.1
6 1899 18.5
7 2014 18.7
8 1902 19.3
9 1914 20.9
10 1958 21.4

Here are the ten coldest December-February periods in Illinois since 1895. The 1981-2010 statewide average is 29.0 degrees.

Rank Year Avg.
1 1977-1978 19.6
2 1978-1979 19.9
3 1935-1936 20.6
4 1917-1918 20.8
4 1976-1977 20.8
4 2013-2014 20.8
5 1903-1904 21.6
6 1962-1963 21.9
6 1904-1905 21.9
7 1981-1982 22.8

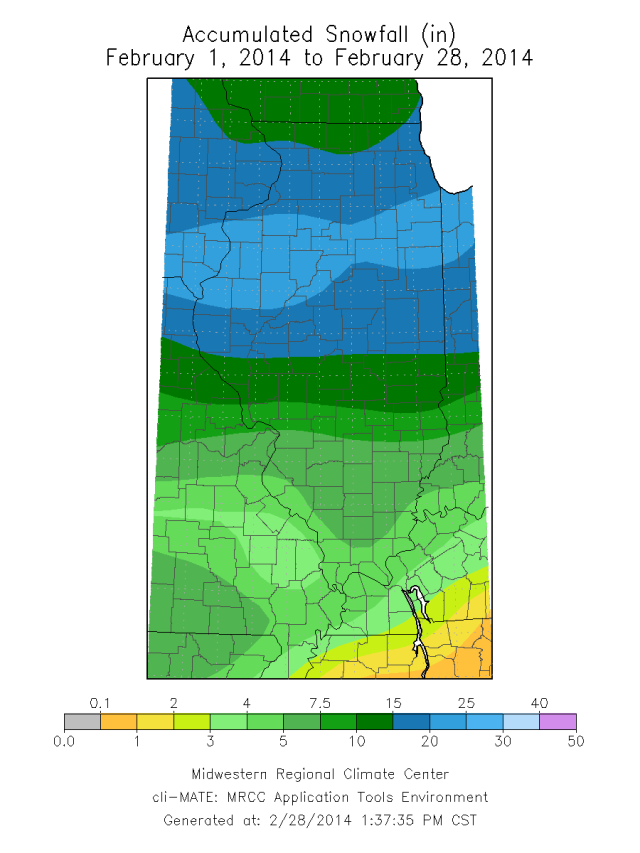
The snowfall for February was above average across the state. The total snowfall ranged from 4 inches in far southern Illinois to 15-20 inches in north-central Illinois. The snowfall departures from average ranged from 1-5 inches south of Interstate 70 and between 10 and 18 inches between Interstates 70 and 80.

feb-snowfeb-snow-dep

The statewide precipitation for February was 2.28 inches. That was just 0.17 inches above average. Precipitation includes both rain events along with the water content of any snowfall. The result in February was that the above-average snowfall did not translate to above-average precipitation because several of those snowfall events occurred in colder conditions when snow density is lower (i.e, fluffier).

By the way, here are the snowfall totals for the entire snowfall season. You may recall that we saw snow flurries back in October and some measurable snow in November. Some of largest snowfall totals this winter are in the Chicago area and include Lincolnwood with 79.8 inches and Oak Park with 78.6 inches.

win-snowwin-snow-depart

Frost Depth in Illinois

One of the effects of this exceptionally cold winter has been that our soils have remained frozen at considerable depths. We have hourly soil temperatures under grass at 19 sites across the state at 4 and 8 inches, available through the WARM website, that give us glimpses of soil conditions.

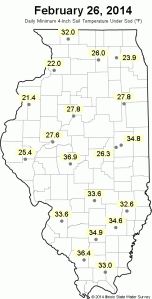
Here are snapshots of the daily low soil temperature at 4 inches yesterday and a week ago when temperatures were much warmer. The 4-inch temperature responded to the warmer weather and showed signs of thawing before re-freezing this week. In many parts of the state, the 8-inch soil temperatures remained frozen during this period. Click on each map to enlarge.

feb21          feb26

Soil temperatures depend on soil types, soil moisture, vegetation, snowcover, and exposure. In general, drier soils warm up and cool faster than wet soils. Both vegetation and snow can insulate the soil for air temperature extremes. I recall the morning of January 5, 1999, when we had a foot of snow on the ground and an air temperature of 25 degrees below zero. Because the winter had been mild up to that week, the soil temperature at 4 inches was 32 degrees, a difference of 57 degrees between 4 inches below ground and 5 feet above ground!

While the above site tracks temperatures at specific depths, the NOAA North Central River Forecast Center maintains a web site with observed frost-depths in Illinois and points to the north. For most of this winter, the frost depth has run in the neighborhood of 10 to 20 inches across Illinois with a few sites going deeper. Here is a screenshot of this morning’s map. While it doesn’t work on the screen shot, you can mouse-over the points on the map on the website and see the individual reports.

North Central River Forecast SoilT

Finally, Wayne Wendland, the former State Climatologist for Illinois, did a frost-depth study in Illinois using data collected from grave diggers from 1980 to 1996. He developed a network of sites across Illinois through the Illinois Cemetery Association and provided post cards that the grave diggers filled out every two weeks in winter. They noted frost depth, soil moisture, soil texture, ground cover, and exposure. The deepest observed frost depths during this period ranged from 5 inches in far southern Illinois to 30 inches in far northern Illinois. The results were published in the Transactions of the Illinois State Academy of Science (pdf).

Illinois Soil Temperatures – Then and Now

You can find 4 and 8-inch soil temperatures for Illinois on the Water Survey’s web site at www.isws.illinois.edu/warm/soiltemp.asp. These data are from a network of 19 sites around Illinois that is maintained by the Survey.
Below are the maps of what the 4-inch soil temperatures looked like on Wednesday and a year ago on the same date. This year the soil temperatures are barely above freezing in northern Illinois and barely above 40 degrees in southern Illinois. On the same date in 2012, the 4-inch soil temperatures were in the upper 50s and lower 60s across the state.
map13
map12