Previous records slashed with monumental cold conditions in Illinois

CHAMPAIGN, Ill., 1/31/19: Illinois has been experiencing some of the coldest weather that has been seen in decades and, in some locations, ever.

The National Oceanic and Atmospheric Administration cooperative weather observer at Mt. Carroll in northeastern Illinois reported a temperature of -38 degrees on the morning of Jan. 31.

“The temperature in Mt. Carroll may be a new state record, if officially confirmed,” said Brian Kerschner, spokesperson for the Illinois State Climatologist’s Office at the Illinois State Water Survey.

When it appears that a state record temperature may have been broken, a state climate extremes committee reviews the observations to assess its validity. This team typically includes the State Climatologist’s Office, the Midwestern Regional Climate Center, and federal climate experts, such as from the National Weather Service and the National Center for Environmental Information.

Most of Illinois has been in the deep freeze for the past two days. With a recording of -31 degrees, Rockford broke their all-time low temperature, which was previously -27 degrees on Jan. 10, 1982, the National Weather Service Forecast Office in Chicago reports.

During the mornings of Jan. 30 and 31, numerous locations in northern Illinois reported temperatures in the -20s and some locations going below -30 degrees. Minimum temperatures were below 0 degrees throughout most of the state, except for the southern regions. Daily mean temperatures were generally 15 to 20 degrees lower than the 30-year average temperature.

Some other notable temperatures included -35 degrees at Elizabeth, -32 at Galena, -30 at Rochelle, -33 at Aledo, -26 at DeKalb, -22 at Joliet, -21 at Galesburg, -17 in Champaign, and -16 in Decatur.

In the southern counties, Cairo reached 12 degrees and Carbondale and Rosiclare saw 4 degrees.

Numerous schools, businesses, and government offices were closed throughout the state because of the dangerously cold wind chills.

——-

Note: Data for this press release were obtained from the Office of the Illinois State Climatologist, Midwestern Regional Climate Center, and National Weather Service Offices responsible for the state.

Media Contacts: Brian Kerschner, (217) 333-0729, statecli@isws.illinois.edu

David Kristovich, head of the Climate and Atmospheric Science Section, Illinois State Water Survey, (217) 333-7399, dkristo@illinois.edu

Dryness Across Northern and Central Illinois

After a wet start to the 2014 growing season, we have seen a significant drop in rainfall across parts of northern and central Illinois in the last few weeks. Here is the 30-day rainfall as a percent of average. Areas in the orange are 25 to 75 percent of average while the areas in red are less than 25 percent of average. There are reports of soil moisture running low in some areas. On the other hand, southern Illinois has received above-average rainfall in the last 30 days.

IL-prcp-mpe-030-pct-20140818

Besides the switch from too wet to too dry in northern and central Illinois, and too much rain in southern Illinois, the other issue is that temperatures have been running about 4 degrees below average for the past 30 days. We are getting some heat this week. However, the longer-term forecasts indicate a return to cooler temperatures and more rain after this week through September 1.

If you look at the last 90 days the heavier rains in June and early July masks the recent dryness (map below). In fact, at the 90 day time scale rainfall in Illinois is generally at or above long-term average (1981-2010), as denoted by the grays and greens. This is one of the challenges of drought monitoring – sorting out short-term dryness versus long-term wetness or vice versa.

IL-prcp-mpe-090-pct-20140818


Cool July – Cool August?

As we approach the end of July the statewide average temperature in Illinois is 70.6 degrees, which currently puts it in second place for the coldest July on record. I will post more on this at the end of the week.

Here is how the previous top 10 coldest July temperatures for Illinois looked and what happened in the following August (table below). In 8 out of the 10 cases, the following August was colder than average. However, two of those “colder” August’s were marginally so (1924 and 1996). The one spectacular reversal was in 1947, where August was 7.2 degrees above average after the 3rd coldest July. Therefore there is a historical tendency for cooler weather to prevail into August.


Temperature (degrees F)
Year July August August Departure
2009 70.3 70.9 -2.7
1924 71.1 73.2 -0.4
1967 71.7 68.2 -5.4
1971 71.9 71.6 -2.0
1950 72.0 69.2 -4.4
1915 72.2 66.9 -6.7
1947 72.3 80.8  7.2
1904 72.4 69.8 -3.8
1905 72.5 74.1  0.5
1996 72.6 73.5 -0.1

We are using the 1981-2010 average for August (73.6 degrees) as the benchmark for this comparison. Statewide records go back to 1895.

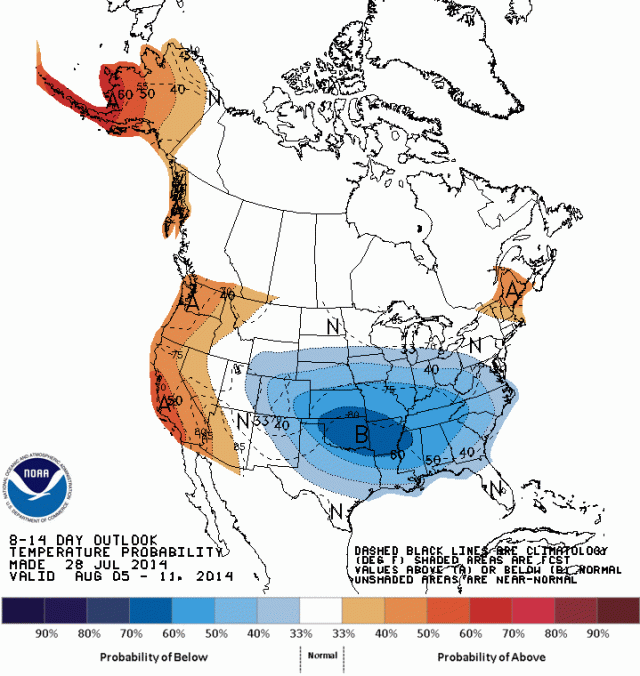
The NWS forecasts are pointing towards a colder than average start to August, based on the latest 6-10 and 8-14 day forecasts.

610temp.new


814temp.new


March Cold and Dry in Illinois

Based on preliminary data, March 2014 in Illinois was cold and dry.

Temperature

The statewide average temperature was 33.8 degrees, which was 7 degrees below average and the 8th coldest March on record. Combined with the colder-than-average January and February made this the 4th coldest start (23.6 degrees) for Illinois for the year to date.

This was the fifth month in a row with temperatures much below average in Illinois. At this point, it was the second coldest November-March on record for Illinois at 29.1 degrees. See the bar graph below showing monthly temperature departures since January 2013.

If this cold March felt familiar, it was because last March was cold as well. The statewide average temperature for March 2013 was only 34.1 degrees.

image004

Precipitation

The statewide average precipitation was 1.49 inches, which strangely enough was 1.49 inches below average and the 11th driest on record. The statewide average precipitation last March was much higher at 2.74 inches. Eight out of the last nine months have had below-average precipitation. As a result, the statewide precipitation departure since July 1 was 7.2 inches.

image011


The first map below is the accumulated precipitation for March (rain plus the water content of any snow event). Most of the state received between 1 to 2 inches of precipitation. It was wettest in the far south and driest in the northwest.

The second map shows the precipitation departures from average for March, showing all areas of the state with below-average precipitation. This would be of more concern if March had been warm. However, with the colder conditions very little drying took place.

Snowfall

The third map shows the snowfall for March. Amounts were in the 1 to 5 inch range in the southern half of the state and 5 to 15 inches or more in the northern half. Mendota reported the highest monthly total of 17.9 inches.

The fourth map shows the snowfall departure from average for March. The entire state was above-average on snowfall for the month. While it seems like a contradiction to report above-average snowfall and below-average precipitation for March, it really is not. The problem is that we have had few rainfall events in March, which was unusual. So we ended up with a lot of snow but the water content of all that snow did not make up for the lack of rain. map_btd


map_btd (1)

map_btd (2)

map_btd (3)