October Warm and Dry So Far in Illinois

October has been both warmer and drier than average so far for Illinois.

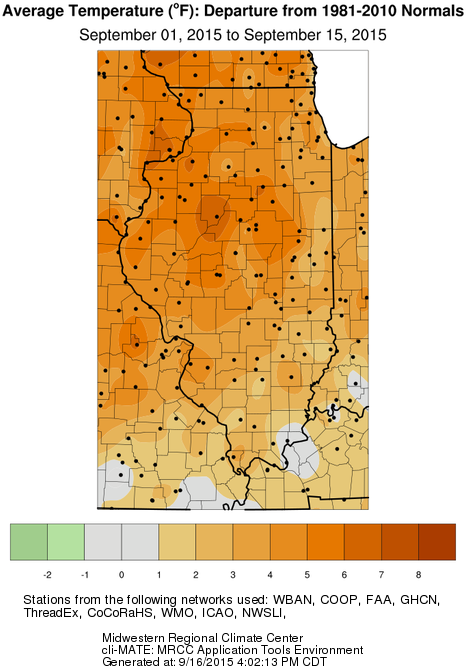
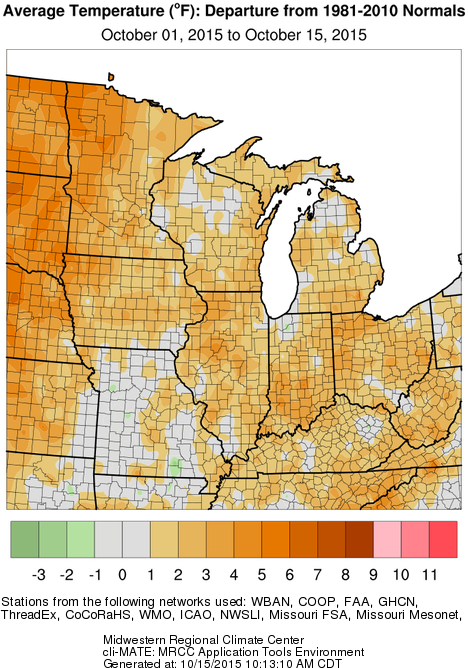
Temperatures have run 1 to 2 degrees above average in Illinois and across most of the Midwest (first map). This follows close on the heels of a September that is now considered the 8th warmest on record at 70.4 degrees according to NCEI.

map1

Meanwhile, precipitation has been largely missing in action in October (map below). The areas in gray across Iowa, and parts of surrounding states indicate almost no measurable precipitation has fallen. It’s hard to tell on this map because of the scale, but most of Illinois has received less a tenth of an inch for the month so far. The statewide average is 0.05 inches.   Continue reading “October Warm and Dry So Far in Illinois”

The Great Pumpkin Shortage of 2015 in Illinois

I have received several calls already about the shortage of pumpkins in Illinois. This pertains not only to the decorative ones seen everywhere, but especially for the processed varieties grown around Morton Illinois. Time Magazine had a short article saying that 90% of the processed pumpkin production comes from Illinois and that they expect a one-third drop in production this year. Here is an excellent article describing pumpkin production in Illinois.

What Happened?

The primary cause of the current shortage is the record-setting precipitation in June. It didn’t help that May and July were wetter than average as well. Statewide, the average precipitation in June was 9.43 inches, 5.33 inches above average and the wettest June on record. In the map below, amounts of 5 to 10 inches (shades of blue) were common across the state. Continue reading “The Great Pumpkin Shortage of 2015 in Illinois”

September: Ninth Warmest on Record for Illinois

Based on preliminary data, September 2015 was the ninth warmest September on record for Illinois. The statewide average temperature was 70.2 degrees, 4 degrees above average. The warmest September on record was 1933 with 72.2 degrees.

The statewide average precipitation for September was 3.42 inches, 0.19 inches above average. However, the precipitation was unevenly distributed around the state as shown in the maps below. Most of the state received between 3 to 5 inches (shades of blue), while western and far southern Illinois were much drier with less than 3 inches of precipitation.

Continue reading “September: Ninth Warmest on Record for Illinois”

First Half of September in Illinois – Warmer than Average

The first half of September in Illinois was warmer than average, about 3.5 degrees above average.

map2

Precipitation for the first half of September is mixed. A few areas east of St. Louis and along the eastern border with Indiana have seen 3 to 4 inches, which is well above average. Much of the rest of the state has seen a respectable 1 to 3 inches. Western Illinois has been drier.

map3
map1