Soil Temperatures in Illinois

The Illinois State Water Survey maintains a network of 19 soil temperature sites across the state that measure temperatures at 4 and 8 inches. You can look at maps for 10 am, any hour of the day, high for the day, low for the day, under sod, and under bare soil. You can find all their data at this site: http://www.isws.illinois.edu/warm/soiltemp.asp 

Here is the 4-inch soil temperature from yesterday. It’s always a day behind so that they can upload the data and do quality control checks. The data now arrive hourly. My mistake – they used to upload the data once a day and do QC but now it is more timely. As you would expect, soil temperatures change more slowly than the air temperatures.

map


And here is what it looked like two years ago after a record warm March. I chose April 2, 2012 for the same time of day and depth. As you can see, the soil temperatures were about 12 degrees warmer and USDA NASS reported that 5% of the corn crop had already been planted by that date.

map (1)

The Tale of Two Winters – One Dry, One Wet

We have had a remarkable contrast in the last two winters in terms of precipitation. While both winters have been relatively quiet in terms of snow (at least up until the last week), this winter has made up for it in rainfall.
Here are the January 1 to February 25 precipitation departure maps for 2012 (first figure) and 2013 (second figure) for the Midwest. Precipitation is the combination of rainfall and the water content of any snow/sleet/freezing rain events.
Areas in shades of yellow show below-average precipitation while areas in shades of green show above-average precipitation. As you can see, the widespread yellow in 2012 was replaced with widespread green in 2013. This is good news for Illinois and for the Midwest.
First two months of 2012.
First two months of 2013.

Soil Temperatures in Fall in Illinois

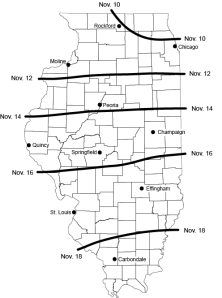
The Illinois Agronomy Handbook recommends that fall N applications should be done when the daily maximum bare soil temperature at 4 inches is below 50 degrees. Fall application is not recommended south of Illinois Highway 16.
The Illinois State Water Survey’s Water and Atmospheric Resource Monitoring (WARM) program has a network of 19 sites around Illinois with daily soil temperature readings at 4 and 8 inches. You can see the reports from “yesterday” on their soil temperature page. Be sure to look at the daily maximum 4-inch bare soil temperature.
As of this writing (November 4), the daily maximum 4-inch bare soil temperature is below 50 degrees in the northwest part of the state. However, it is still in the low to mid 50s across northeastern and much of central Illinois.
Of course, the soil temperature in a particular field can vary due to the temperature, soil moisture, vegetation and tillage, and even soil color.
The figure below shows the average date when the 4-inch soil temperature reached 50 degrees in the fall. In general the average date was in mid-November. However, it can vary from year to year depending on weather and soil conditions.

Average date when soil temperatures at 4 inches reach 50 degrees.Click to enlarge.

Dry October in Illinois

Precipitation

The statewide average precipitation for October in Illinois was 1.79 inches, 1.12 inches below average or 61 percent of average. That makes it the 21st driest October on record back to 1895. See map below.
Amounts of less than an inch were common in western Illinois. The driest spot for October in Illinois was Colchester (near Macomb) with 0.22 inches for the month. The wettest spot in Illinois was Lansing (south Chicago) with 5.22 inches.
Moderate to severe drought remains in western Illinois, according to the U.S. Drought Monitor. The National Weather Service has predicted above-average precipitation for November across Illinois. Combined with cooler temperatures, this should lead to improvements in that area of the state.

Temperature

The statewide average temperature for October in Illinois was 55.1 degrees, just 0.5 degrees above average. The highest temperature for October in Illinois was 92 degrees at Bentley on October 8. The lowest temperature was 23 degrees at Mt. Carroll on October 29. Most of Illinois experienced temperatures at or below freezing by the end of the month.

Snowfall

No measurable snow reported yet. I’m sure that will change in November.

October precipitation
October precipitation (inches) for 2011 in Illinois. Click to enlarge.

October precipitation departure
October precipitation departure (inches) for 2011 in Illinois. Click to enlarge.