December Brought a Mix of Everything to Kick Off Winter

The preliminary statewide average December temperature was 29.4 degrees, 0.6 degrees below the 1991–2020 average and the 61st coldest on record going back to 1895. The preliminary statewide average total December precipitation was 2.62 inches, 0.21 inches above the 1991–2020 average and 43rd wettest on record statewide.    

Data are provisional and may change slightly over time.

Unusual Extreme Cold in Late December

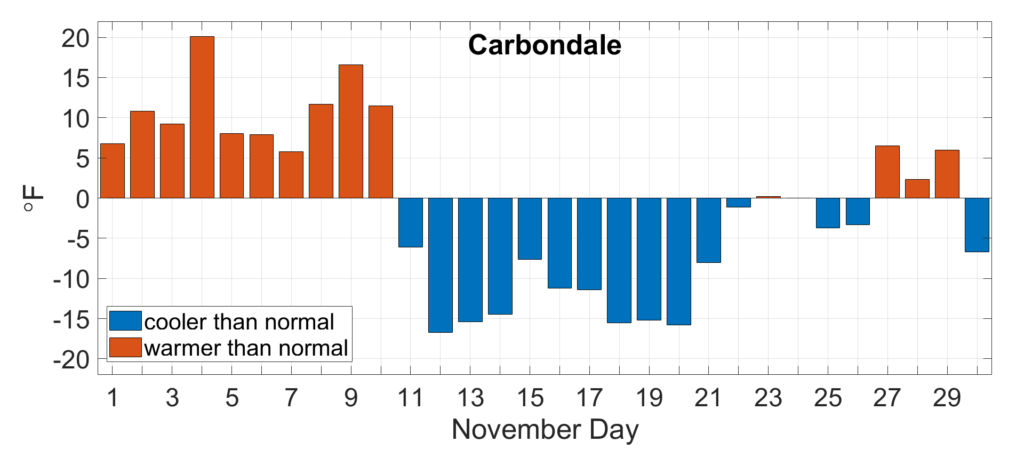
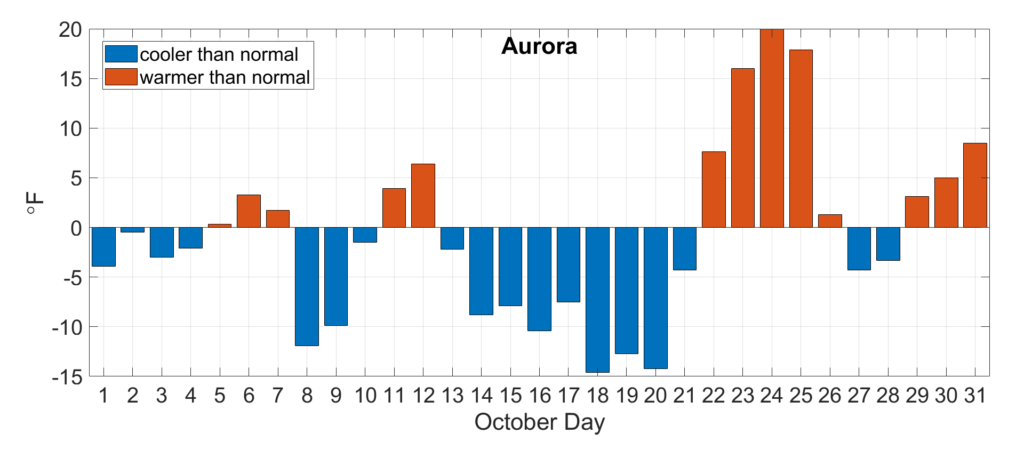
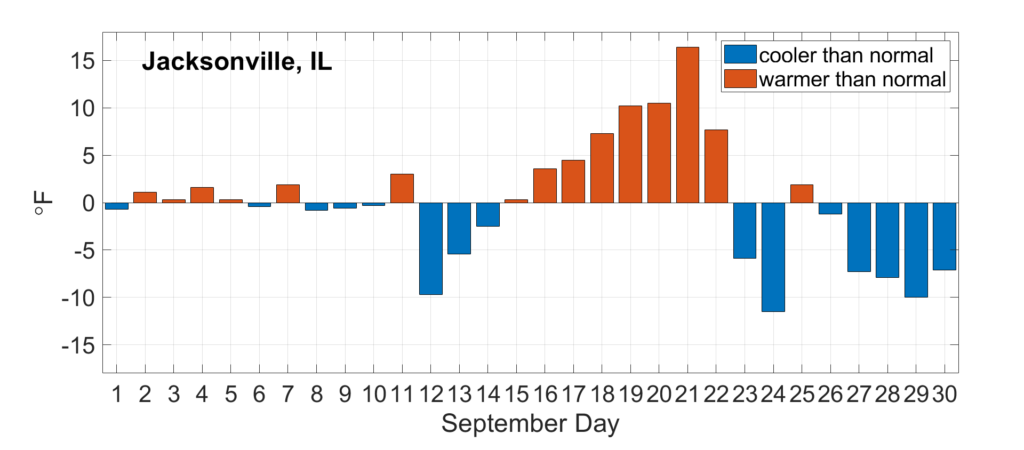
December 2021 was the second warmest on record in Illinois. The unusually warm December weather was accompanied by tornado outbreaks, extreme rainfall, and the latest first measurable snowfall on record in Chicago (December 28th). This year was quite a bit different, with much closer to, in not slightly warmer than normal temperatures in the first half of the month, followed by an extreme cold outbreak and rapid warmup in the second half. The plot of daily temperature departures from normal in Peoria shows the intensity of cold around Christmas, and how quickly extremely cold air was replaced with much warmer weather. In fact, Peoria went from -33 degree temperature anomalies on December 23rd to +26 degree temperature anomalies on December 29th, the quickest the city has experienced this magnitude of change on its 140+ year record.


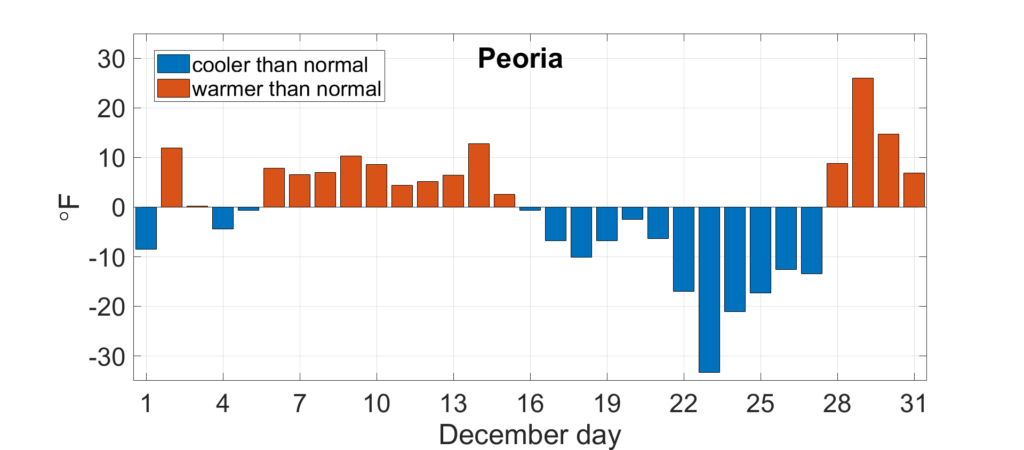
Figure 1. Daily December average temperature departures in Peoria.

A strong winter storm moved through the Midwest in late December, bringing extremely cold Arctic air into the region. Actual temperatures recorded in Illinois in the final two weeks of the month include -15 degrees in Knox and Mercer Counties, -12 degrees in Lee and Cook Counties, and -11 in McLean and Champaign Counties. Combined with 25+ mph sustained winds and 45+ mph wind gusts, wind chill values were in the -25 to -40 degree range. The extreme temperatures and wind chill values are very unusual for late December, only occurring in northern and central Illinois once every 20 to 25 years. As often happens, a strong ridge followed the intense trough in the jet stream, and the state warmed up quickly in the last week of the month. High temperatures ranged from the low 50s to mid-60s, between 10 and 25 degrees above normal.

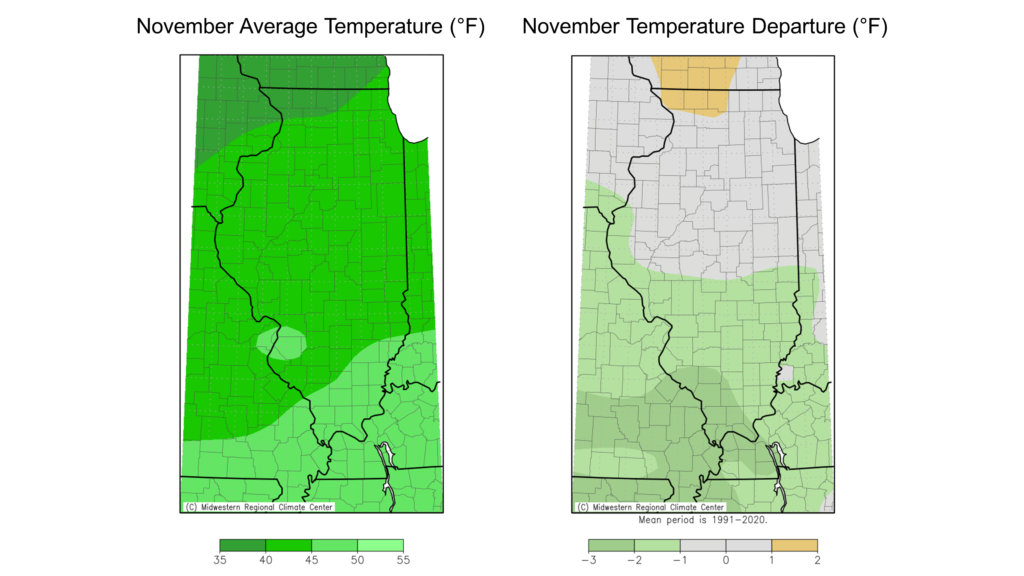
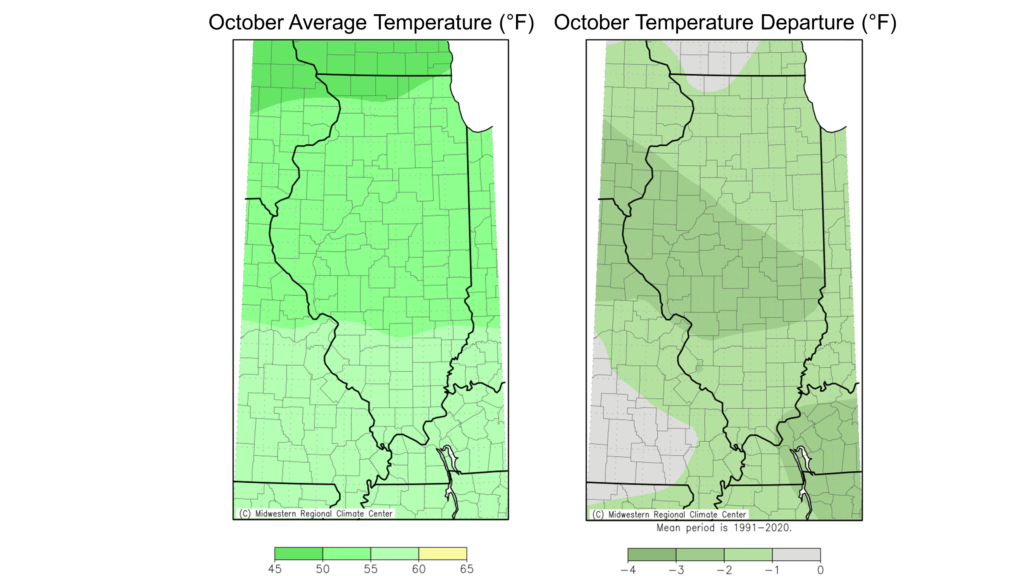
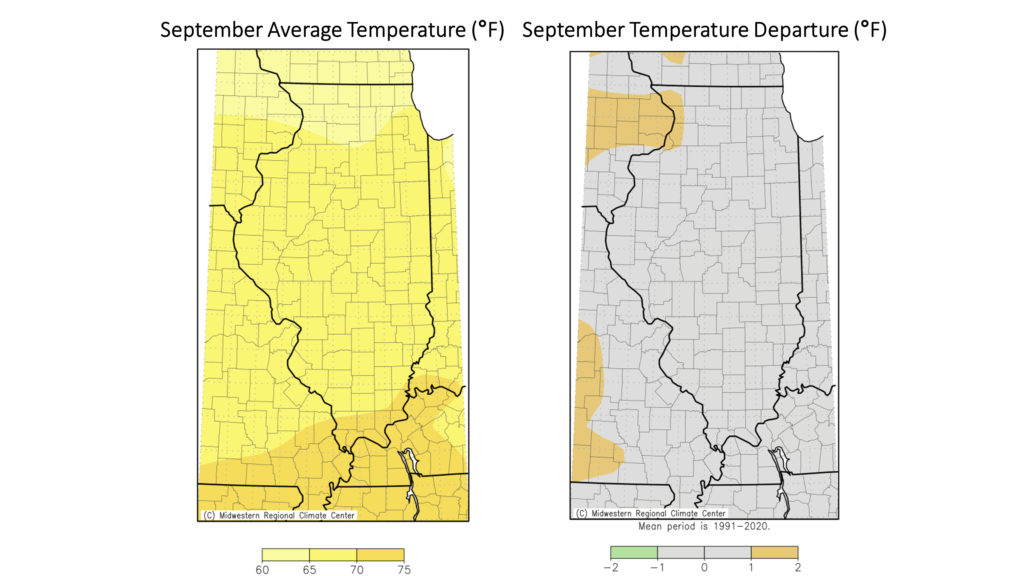
When taken altogether, December average temperatures ranged from the low 20s in northern Illinois to the high 30s in southern Illinois, within 1 degree of normal (Figure 2). The warmest place in the state last month was Olmsted in Pulaski County with an average December temperature of 37.1 degrees. The coolest place in the state was Elizabeth in Jo Daviess County with an average December temperature of 22.4 degrees.

Figure 2. Maps of (left) December average temperature and (right) December average temperature departures from normal.

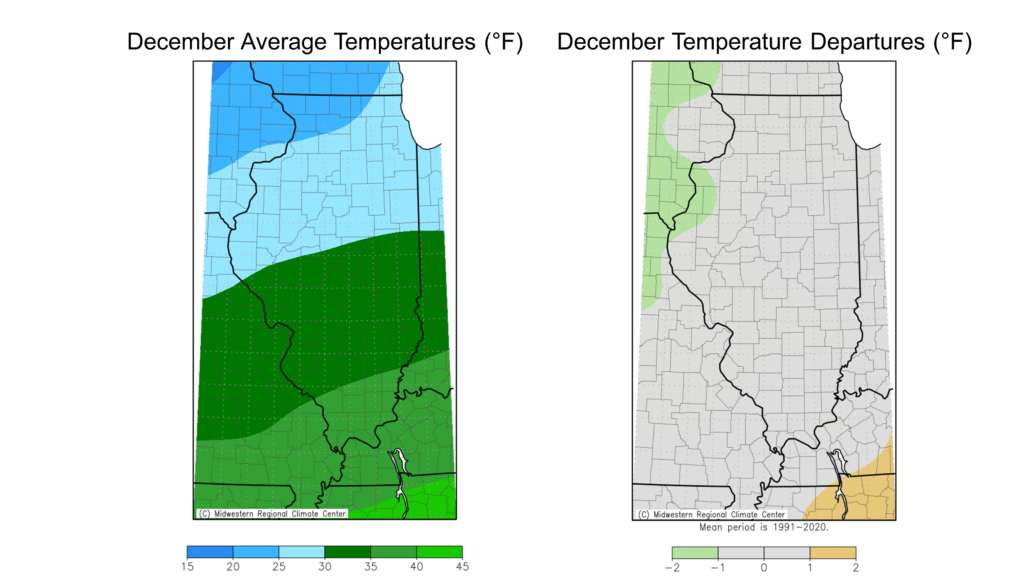
While no daily high maximum temperature records were broken last month, daily high minimum temperature records were broken at two stations. Meanwhile, the extreme cold in late December broke low maximum temperature records at 11 stations and low minimum temperature records at 5 stations. The station in Robinson in Crawford County set a new all-time December low temperature record of -9 degrees, breaking the old record of -8 degrees set in 1901.

Overall, the preliminary statewide average December temperature was 29.4 degrees, 0.6 degrees below the 1991–2020 average and the 61st coldest on record going back to 1895.statewide.

Some Rain, Some Snow, and a White Christmas (for some)

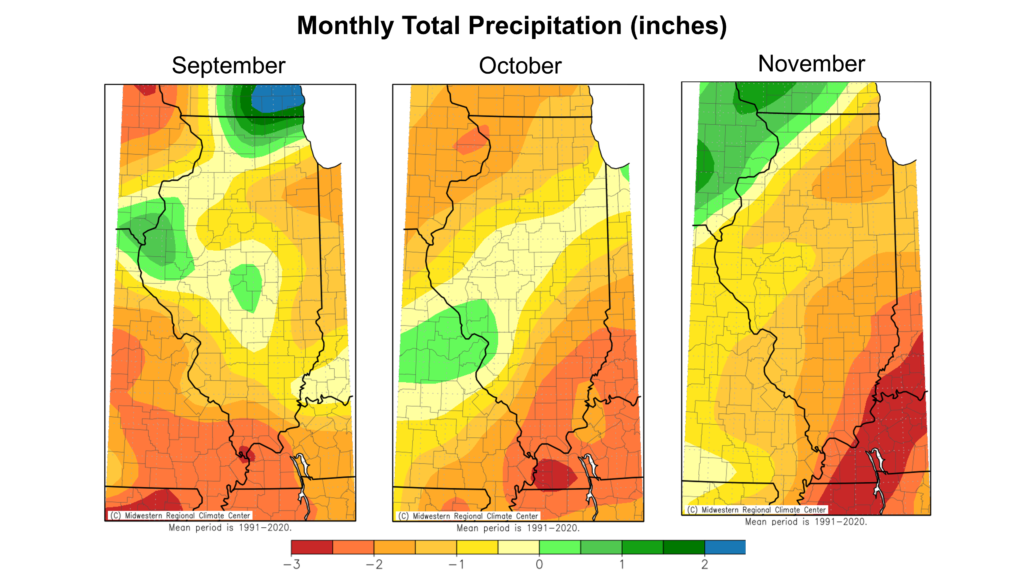
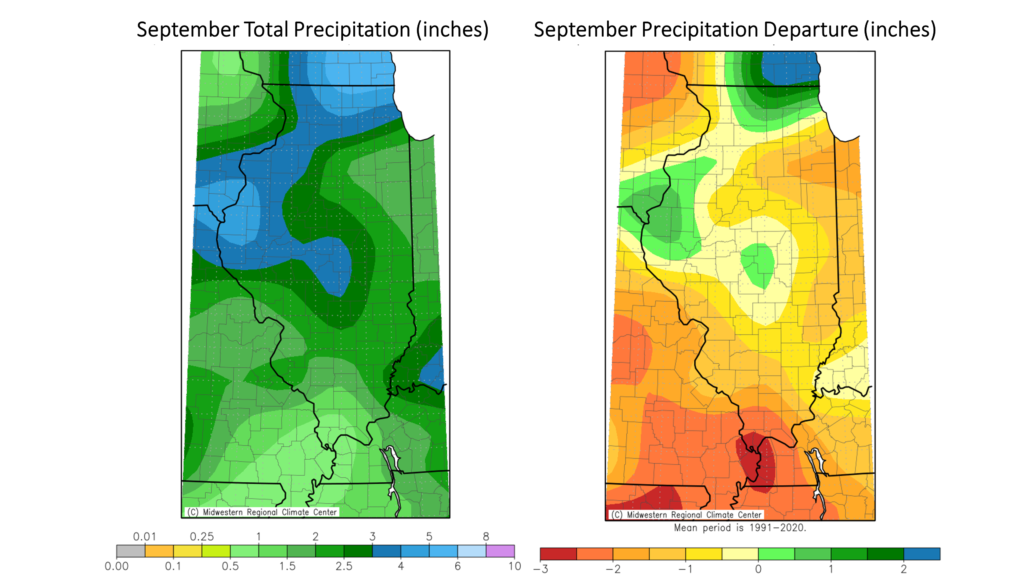
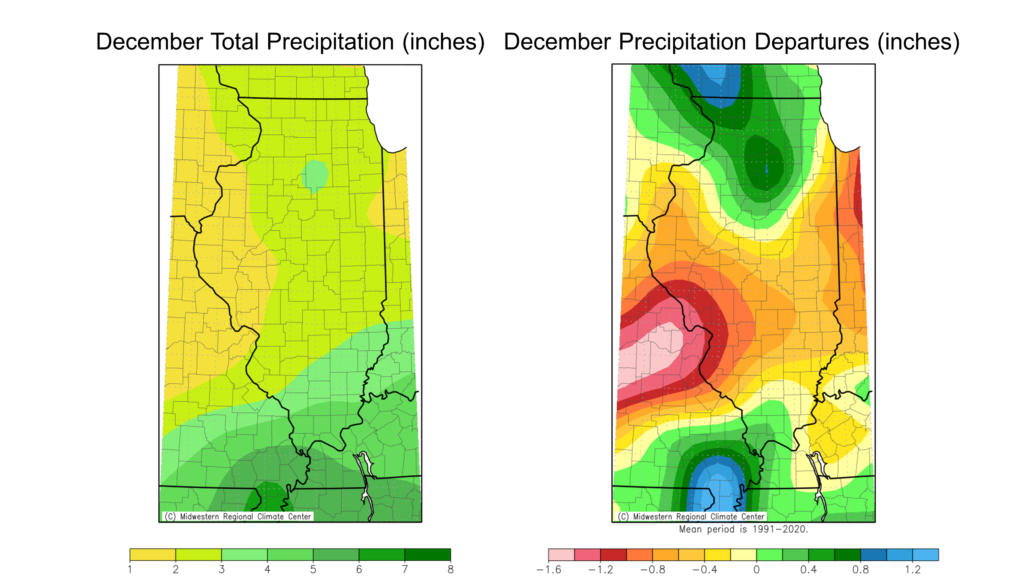
Most of the state entered the first month of climatological winter drier than normal with some parts of southern Illinois having precipitation deficits of 8 to 10 inches going back to the summer. While December didn’t eliminate drought issues, the near normal precipitation last month put us on the road to drought improvement.

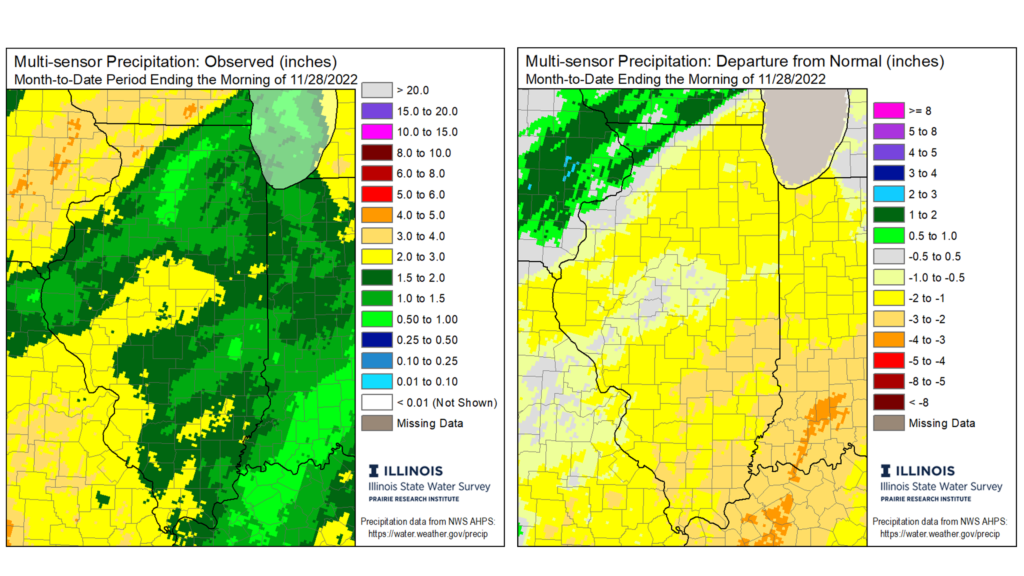
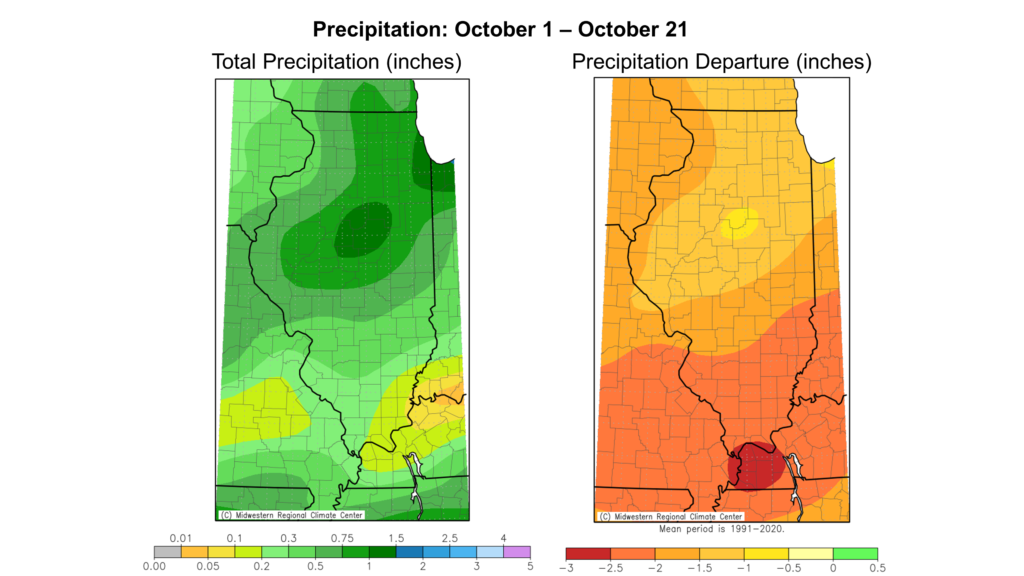
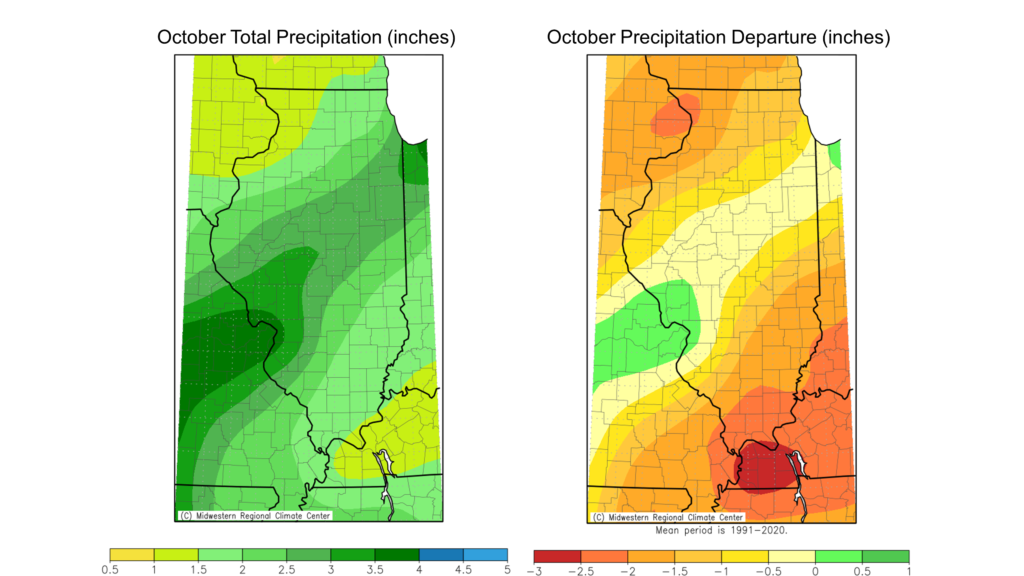
December total precipitation ranged from just under 2 inches in western Illinois to over 5 inches in far southern Illinois. Most of central and south-central Illinois was 0.5 to 1.5 inches drier than normal last month, while northern and southern Illinois were 0.5 to 1.5 inches wetter than normal. December was the first wetter than normal month since July in parts of far southern Illinois.

Overall, the preliminary statewide average total December precipitation was 2.62 inches, 0.21 inches above the 1991–2020 average and 43rd wettest on record statewide.      

Figure 4. Maps show (left) December total precipitation and (right) December precipitation departure from normal

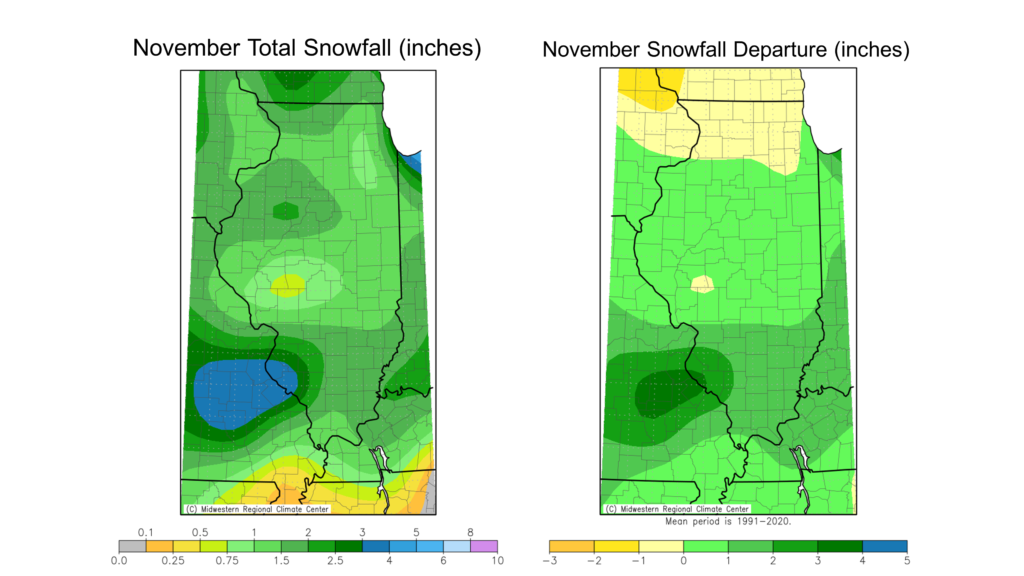
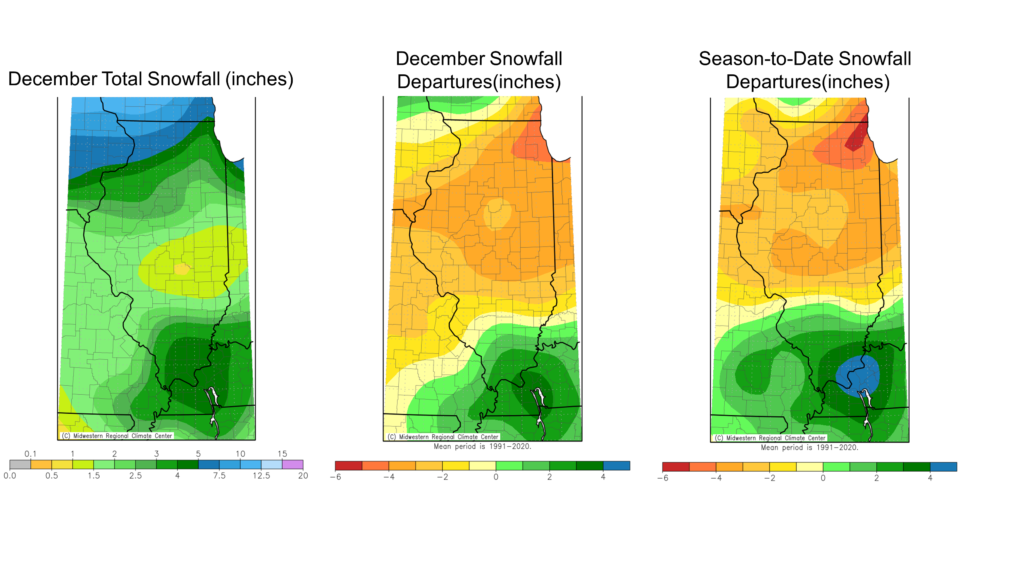
While the extreme temperatures and wind were the main storylines of the winter storm in late December, the storm did bring modest snowfall to the northern two-thirds of the state. A weaker storm system moved through the mid-South in early December, making for a snowier than normal December in southern Illinois, while snowfall totals were 1 to 5 inches below normal north of Interstate 64. The same snowfall pattern exists for the winter season to date, with areas north (south) of Interstate 64 having 1 to 5 inches below (above) normal snowfall.

Figure 5. Maps show (left) December snowfall totals (middle) December snowfall departures from normal and (right) winter season to date snowfall departures.

Outlooks

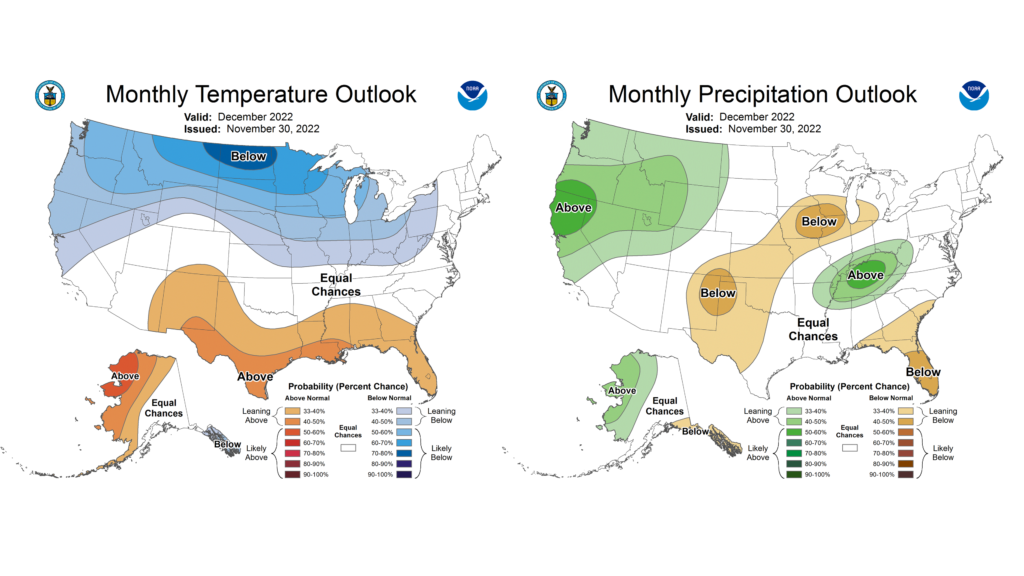
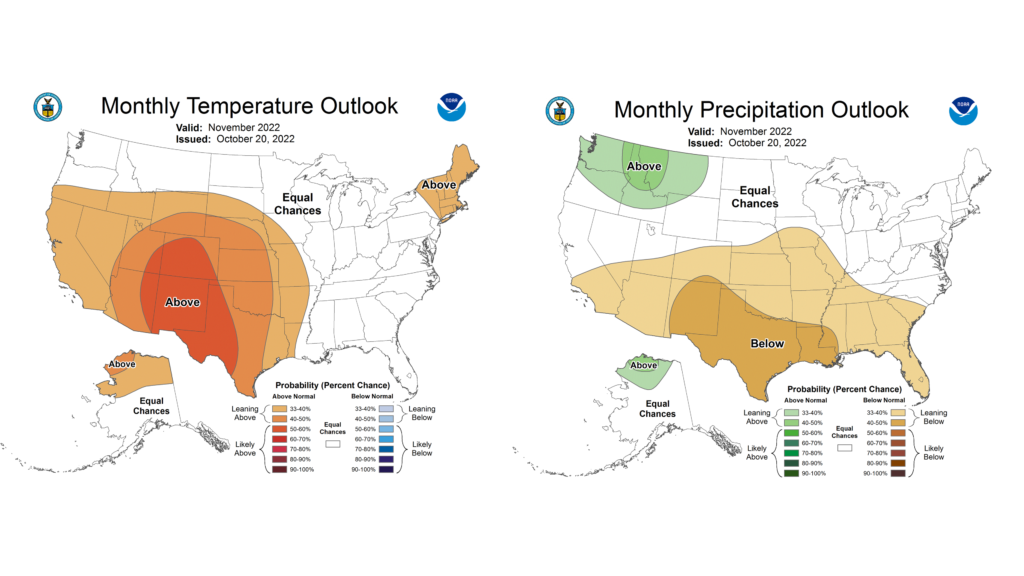
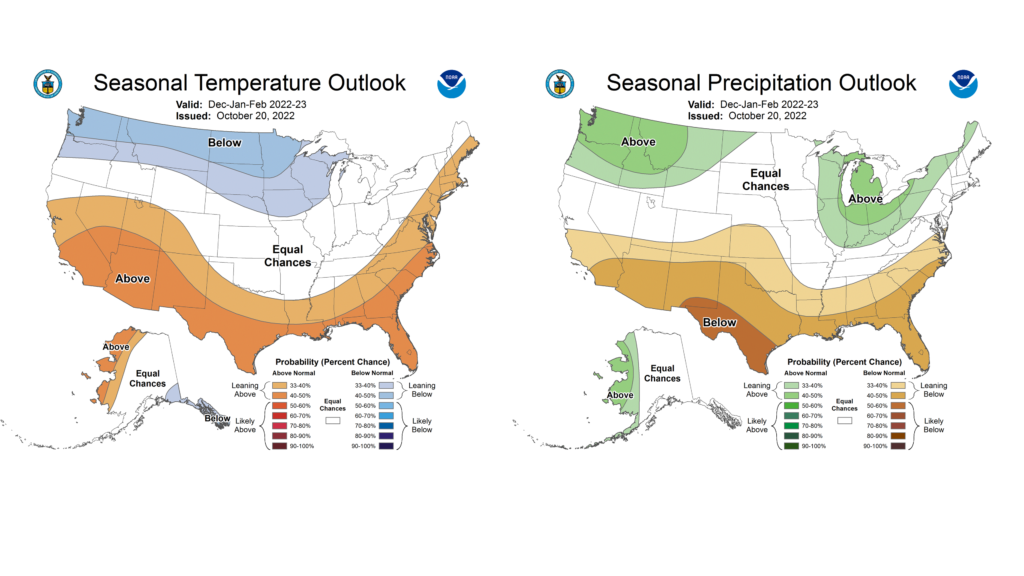
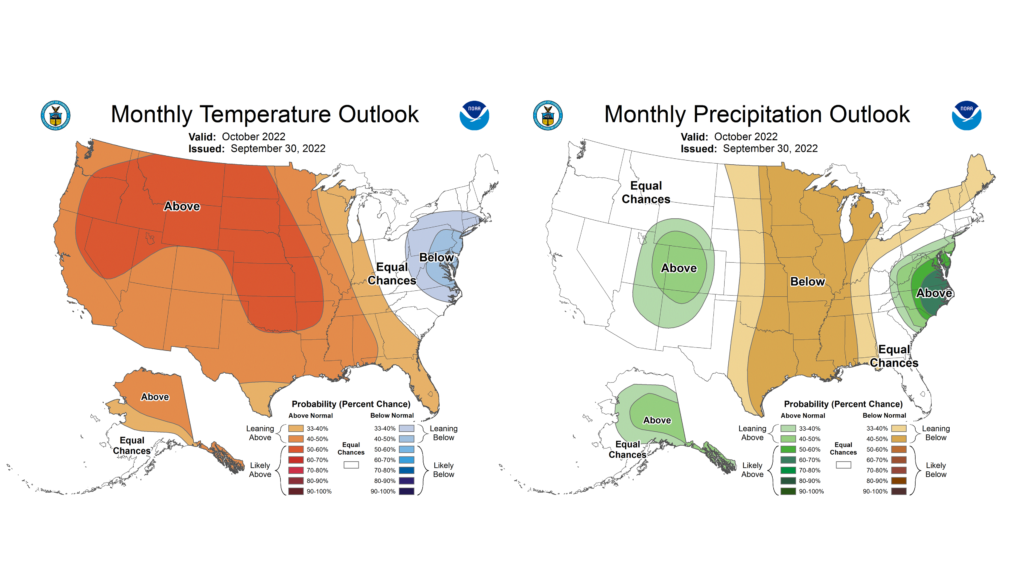
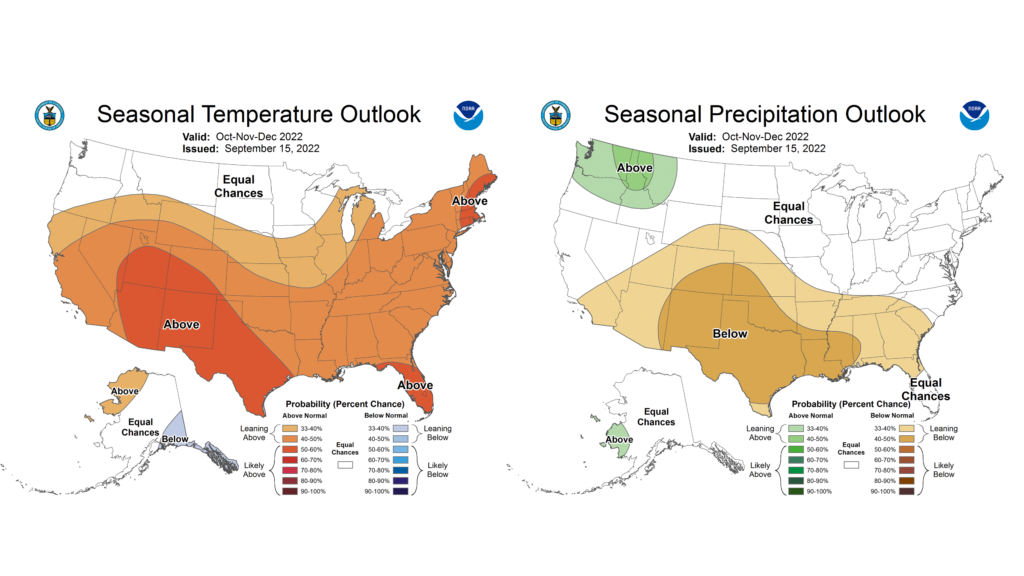
Climate Prediction Center outlooks for January lean into a late-blooming La Niña-esque pattern, leaning to warmer and wetter than normal weather to kick off 2023 (Figure 6).  


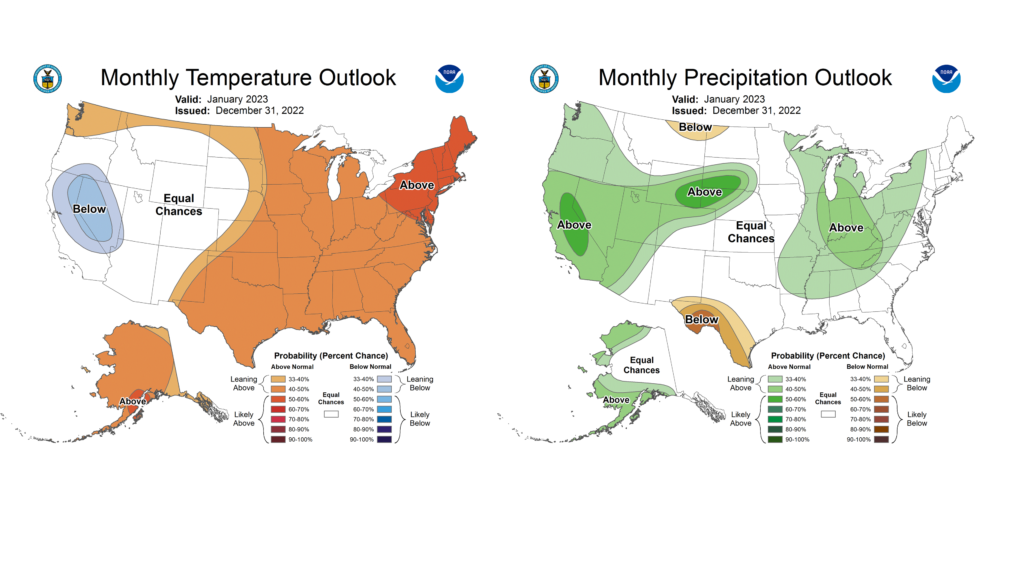
Figure 6. Maps show (left) temperature and (right) precipitation outlooks for January.

Big Temperature Swings in November, which Wraps Up an Otherwise Mild Fall

The preliminary statewide average November temperature was 42.3 degrees, 0.6 degrees above the 1991–2020 average and tied for 45th warmest on record going back to 1895. The preliminary statewide average total November precipitation was 1.92 inches, 1.40 inches below the 1991–2020 average and the 39th driest on record statewide.    

Data are provisional and may change slightly over time.

November Temperature Swings

November began with unusually warm weather across the state. As Figure 1 shows, the first 10 days of the month were 5 to 20 degrees warmer than normal in Carbondale. A strong cold front moved through around November 11, ushering out the warmer air and replacing it with unusually cold air from Canada. The following 10 days between November 11 and the 20th were 5 to 15 degrees colder than normal. November is known for intense temperature swings as we transition from fall to winter; however, this month’s swing was particularly extreme. For example, the average temperature in the first 10 days of the month was the 2nd highest on record in Paducah, Kentucky. The following 10 days had an average temperature that was the 3rd lowest on record. Temperatures moderated in the final 10 days of the month across the state.

Figure 1. Daily November average temperature departures in Carbondale.

Several places in the state had temperatures reach into the low to mid-80s in the first 10 days of November, including 82 degrees in Cahokia Heights and Cairo. Meanwhile, the cold air outbreak in the middle of the month brought nighttime low temperatures into the teens and single digits across the state, including 8 degrees in Monmouth and Champaign. Any place that missed out on a 28-degree hard freeze in October reached that mark multiple times in November.

November average temperatures ranged from the high 30s in northern Illinois to the low 50s in southern Illinois, within 1 degree of normal in the northern half of the state and between 1 and 3 degrees below normal in southern Illinois (Figure 2). The warmest spot in the state last month was Dixon Springs in Pope County with an average temperature of 46.7 degrees, and the coolest spot in the state was Elizabeth in Jo Daviess County with an average temperature of 38.7 degrees.

Figure 2. Maps of (left) November average temperature and (right) November average temperature departures from normal.

The warm start to November broke 50 daily high maximum temperature records and broke 4 daily high minimum temperature records last month. The subsequent cold weather broke 30 daily low maximum temperature records and broke 27 low minimum temperature records last month.

Overall, he preliminary statewide average November temperature was 42.3 degrees, 0.6 degrees above the 1991–2020 average and tied for 45th warmest on record going back to 1895.

A Mild Fall

Fall 2021 was the 10th warmest on record statewide, including the 4th warmest October on record statewide. Although some may enjoy an extension of summer, the unusually warm weather last year challenged many of the fall activities. In contrast, we enjoyed mild temperatures this fall, making for a great season to be outdoors in Illinois. As Figure 3 shows, September was within 1 degree of normal statewide, October was 1 to 3 degrees cooler than normal, and November was near to slightly cooler than normal statewide.

Overall, the statewide fall 2022 average temperature was 54.1 degrees, 0.1 degrees below the 1991–2020 normal and tied for 64th coolest on record.


Figure 3. Maps show average temperature departures for September, October, and November.

Dry November Didn’t Bring Drought Help

November is typically one of our drier months outside of the winter, so we don’t expect November to make a big dent in precipitation deficits from the summer and fall. This year November played to type and continued the drier than normal weather streak for most of the state. Total November precipitation ranged from nearly 4 inches in northwest Illinois to less than 1.5 inches in east-central and southeast Illinois. Only the northwest sliver of the state was wetter than normal last month, while southeast Illinois was 2 to 3 inches drier than normal (Figure 4).

Figure 4. Maps show (left) total November precipitation and (right) November precipitation departure from normal.

Despite the drier weather in November, virtually all the state saw near to above normal snowfall last month. As Figure 5 shows, November snowfall totals ranged from over 7 inches in southwest Illinois to just less than 1 inch in central Illinois. All areas south of Interstate 80 had above normal snowfall, while northern Illinois had just less than normal November snowfall.


Figure 5. Maps show (left) total November snowfall and (right) November snowfall departure from normal.

A strong low-pressure system swung through the middle Mississippi region in mid-November and brought sometimes heavy snow to the St. Louis Metro East area. Parts of Belleville, Mascoutah, and Breese picked up between 6 and 8 inches of snow in just a few hours. Waterloo in Monroe County had 8.4 inches of snow last month–most of which came from that one storm–making it the 2nd snowiest November on record there (after 1980). The November snowfall in southern Illinois was not only unusually heavy, but was also abnormally early, especially in far southern Illinois. Paducah, Kentucky–just across the Ohio River from Brookport in Massac County–had its first measurable snow on November 11 this year, the 3rd earliest on record.

Drought Continues

Outside of parts of southwest, east-central, and northwest Illinois that experienced very heavy rain in mid- to late summer, most of Illinois has been somewhat to much drier than normal since July. Long-term precipitation deficits are largest in southern Illinois, where areas from Carbondale to Metropolis have had only 50–60 percent of normal rainfall since July 1.

Unfortunately, the mild fall temperatures were accompanied by drier weather, extending drought conditions across the state. As Figure 5 shows, most parts of the state were drier than normal in at least two of the three fall months, and all three months were drier than normal in southern Illinois.

Figure 6. Maps show total monthly precipitation departures from normal in (left) September, (middle) October, and (right) November.

The result of the dry weather was a continuation–and in some cases, worsening–of drought conditions across the state. The latest U.S. Drought Monitor shows severe to extreme drought across southern Illinois and moderate drought in north-central and northeast Illinois. Although ecological impacts have diminished as we move closer to winter, drought impacts to hydrology have continued. These impacts include low stream, lake, and pond levels across the state and low flow on the Illinois and Mississippi Rivers.

Overall, the preliminary statewide total November precipitation was 1.92 inches, 1.40 inches below the 1991–2020 average and the 39th driest on record statewide. The 2022 fall season preliminary total precipitation was 6.84 inches, 2.58 inches below normal and the 28th driest on record since 1895.

Looking Forward to December & Winter

December is the start to climatological winter and when we typically begin to see our more interesting winter weather. The current Climate Prediction Center outlook for the month of December leans toward cooler than normal weather for the last month of the year. While the outlook leans drier than normal in northern Illinois, there are higher chances for wetter than normal weather in drought-stricken southern Illinois (Figure 7).

Figure 8. Climate Prediction Center (left) temperature and (right) precipitation outlooks for December.

Meanwhile, outlooks for the winter season, December through February, lean more into ongoing La Niña patterns, including higher chances of wetter than normal conditions in winter (Figure 8). If La Niña plays to type and we do see a wetter winter, it would be beneficial for removing or reducing drought across the state. With that said, previous La Niña winters tend to be “back-loaded,” meaning we don’t see the strongest signals until January and February.

Figure 9. Climate Prediction Center (left) temperature and (right) precipitation outlooks for winter (December–February).

October Brought Real Fall to Illinois

The preliminary statewide average October temperature was 53.1 degrees, 1.6 degrees below the 1991–2020 average and tied for the 40th coolest on record going back to 1895. The preliminary statewide average total October precipitation was 2.30 inches, 0.61 inches below the 1991–2020 average and tied for 52nd driest on record statewide.    

Data are provisional and may change slightly over time.

Mild October Temperatures

October 2021 was the fifth warmest on record in Illinois. The unusually warm and rainy weather last year put a damper on both harvest and fall festivities. October this year though did not disappoint fall lovers. October followed September’s lead and brought mostly mild temperatures across the state. As the temperature departures from Aurora in Figure 1 show, 16 of the first 21 days in October were cooler than normal, and many were 5 to 15 degrees below normal. Only the third week of the month had temperatures more than 10 degrees above normal. Average October high temperatures ranged from the low to high 60s, with lows in the 40s and low 50s. The result was very pleasant weather across the entire month, which, along with dry conditions, permitted a relatively quick harvest and plentiful opportunities to enjoy fall festivities.

Figure 1. Daily October average temperature departures in Aurora.

Cool October nights brought regular frost across the state, and an earlier than normal first fall freeze. For example, Du Quoin recorded its first fall 32-degree freeze on October 9, about 10 days earlier than the 1991–2020 average. Most places saw nighttime temperatures dip below the hard freeze mark of 28 degrees later in the month, including a 20-degree low in Monmouth and a 22-degree low in Carbondale.

October average temperatures ranged from the upper 40s in northern Illinois to the mid-50s in southern Illinois, between 1 and 4 degrees below normal (Figure 2). The warmest place in the state last month was Olmsted in Pulaski County with an average October temperature of 58.9 degrees. The coolest place in the state was Elizabeth in Jo Daviess County with an average October temperature of 49.2 degrees.

Figure 2. Maps of (left) October average temperature and (right) October average temperature departures from normal.

Daily high maximum temperature records were broken last month at 8 stations, and daily high minimum temperature records were broken at 1 station. Daily low minimum temperature records were also broken at 17 stations. Cairo tied its all-time October low minimum temperature record with a 25-degree low on October 19.

Overall, the preliminary statewide average October temperature was 53.1 degrees, 1.6 degrees below the 1991–2020 average and tied for the 40th coolest on record going back to 1895.

Continued Dryness Causes Issues

September was drier than normal in most places around the state, and the dryness persisted into the first two-thirds of October (Figure 3). Most areas picked up less than 1 inch of total precipitation between October 1 and 21, 1 to 3 inches less than normal over the time period.

The dryness in southern Illinois was part of a larger pattern for the Ohio and Lower Mississippi River basins. In fact, the entire Lower Ohio valley, from Louisville to Cairo, only picked up 0.60 inches of total rainfall on average between September 1 and October 21. The exceedingly dry conditions contributed to very low flows and navigation issues along the Ohio and Mississippi Rivers. Extremely dry soils particularly in southern Illinois also increased the risk of fire and forced multiple counties to impose burn bans for most of the month. Despite the bans, several wildfires and field fires broke out in southern and central Illinois in October, including a fire that burned at least 115 acres in Jefferson County. One benefit of the persistently dry conditions was that it aided a relatively smooth harvest. On the other hand, low flow and navigation issues along the Mississippi River from the dry weather has contributed to higher transportation costs and grain storage issues.

        Figure 3. Maps show (left) total precipitation and (right) precipitation departure from normal between October 1 and 21.      

The last week of the month brought wetter weather statewide, including a few places that picked up 3 to 4 inches in a single week. October total precipitation ranged from over 4 inches in southwest Illinois to less than 1.5 inches in far northwest Illinois (Figure 4). The Interstate 55 corridor between St. Louis and Chicago was the only part of the state near to slightly wetter than normal, whereas northwest and southern Illinois were 1 to 3 inches drier than normal last month.

Overall, the preliminary statewide average total October precipitation was 2.30 inches, 0.61 inches below the 1991–2020 average and tied for 52nd driest on record statewide.   

Figure 4. Maps show (left) October total precipitation and (right) October precipitation departure from normal

Outlooks

Climate Prediction Center outlooks for November mostly point to equal chances of warmer/cooler and wetter/drier than normal conditions (Figure 5). However, as we continue into our third consecutive La Niña cool season, outlooks are increasingly taking a very La Niña-esque appearance. Namely, much of Illinois is leaning toward wetter than normal conditions from December through February (Figure 6). A wetter winter would be beneficial in reducing the soil moisture deficits and improving streamflow as we move into spring.   

Figure 5. Maps show (left) temperature and (right) precipitation outlooks for November.
Figure 6. Climate Prediction Center (left) temperature and (right) precipitation outlooks for December through February.

Dry and Mild Start to Fall

The preliminary statewide average September temperature was 66.8 degrees, 0.6 degrees above the 1991–2020 average and the 57th warmest on record going back to 1895. The preliminary statewide average total September precipitation was 2.66 inches, 0.53 inches below the 1991–2020 average and the 41st driest on record statewide.    

Data are provisional and may change slightly over time.

A Mostly Mild September

September followed August’s lead and brought mostly mild temperatures across the state. As the temperature departures from Jacksonville in Figure 1 show, the only prolonged warm period last month was in the third week, when temperatures were 5 to 15 degrees above normal. A cold front swept through Illinois around the fall equinox and brought much cooler, fall-like weather to wrap up the first month of climatological fall.

Figure 1. Daily September average temperature departures in Jacksonville.

During the hot week in the third week of September, high temperatures reached into the mid- to upper 90s across the state. Among the very high temperatures was 99 degrees observed in Carbondale on Sept. 21, tied with 1940 and 1955 for the second latest 99+ degree temperature on record in Carbondale.

However, the cold front that moved through the state around Sept. 21 brought much cooler, drier air into the region. Nighttime low temperatures in the final week of the month regularly dipped into the upper 30s and low 40s. A few stations even reached the 32-degree mark in the last week of September, including the 19th earliest first fall freeze on record in Normal.

September average temperatures ranged from the low 60s in northern Illinois to the low 70s in southern, within 1 degree of normal statewide (Figure 2). The warmest place in the state last month was Bean Ridge in Alexander County with an average September temperature of 72.8 degrees. The coolest place was Stockton in Jo Daviess County with an average September temperature of 63.0 degrees.

Figure 2. Maps of (left) September average temperature and (right) September average temperature departures from normal.

Daily high maximum temperature records were broken last month at 27 stations, and daily high minimum temperature records were broken at 5 stations. Daily low maximum temperature records were broken last month at 4 stations, and daily low minimum temperature records were also broken at 4 stations.  

Overall, the preliminary statewide average September temperature was 66.8 degrees, 0.6 degrees above the 1991–2020 average and the 57th warmest on record going back to 1895.

 Drier Start to Fall

Early to mid-September brought multiple rounds of isolated, heavy precipitation to parts of northern, western, and east-central Illinois. However, significant rainfall eluded most of southern and northeastern Illinois in the first two-thirds of the month. Meanwhile, the final 10 days of the month were cooler and very dry statewide. The result was a much drier than normal September for most of southern and northeastern Illinois and near normal to slightly wetter than normal conditions in parts of northern and west-central Illinois (Figure 3). Specifically, total precipitation last month ranged from over 6 inches in parts of western and northern Illinois to less than 1 inch in far southern Illinois. Smithland Lock and Dam in Pope County recorded only 0.60 inches of rain last month, making it the fourth driest September since 1980 there.

Among the driest points in the state in September was Morton in Tazewell County, which only had 0.58 inches of rain. In contrast, the wettest point in the state in September was Warsaw in Hancock County, with 7.51 inches. One silver lining of the dry weather in the latter half of September was that it allowed a smooth start to fall harvest. However, deteriorating conditions in southern and central Illinois have resulted in an increased fire risk and concerns of low levels in the Mississippi and Illinois Rivers.     

Figure 3. Maps show (left) total September precipitation and (right) September precipitation departure from normal.                                                           

Overall, the preliminary statewide average total September precipitation was 2.66 inches, 0.53 inches below the 1991–2020 average and the 41st driest on record statewide.

The 2021-2022 Water Year

The transition from summer to fall is typically our hydrologically driest time of the year as a result of higher evaporative demand and human demand for water in summer. In contrast, the transition from winter to spring is typically our hydrologically wettest time of the year. Therefore, to best capture the seasonal variability of water availability and water balance, we denote a “water year,” which runs from October 1 to September 30. Figure 4 shows total precipitation and precipitation as a percent of normal for the 2021-2022 water year (October 1, 2021–September 30, 2022). Total water year precipitation ranged from nearly 60 inches in southern Illinois to less than 30 inches in far western Illinois. In all, water year precipitation was between 75 and 125 percent of normal statewide.

Figure 4. Maps show total precipitation and precipitation percent of normal for the 2021-2022 water year.

Outlooks

Climate Prediction Center outlooks for October lean toward warmer and drier than normal conditions statewide (Figure 5). Similarly, outlooks for the last three months of the year also lean toward warmer than normal conditions, with near normal rainfall (Figure 6).

Figure 5. Maps show (left) temperature and (right) precipitation outlooks for October.
Figure 6. Climate Prediction Center (left) temperature and (right) precipitation outlooks for October through December.