Drought Takes Hold After a Warm and Dry May

The preliminary statewide average May temperature was 63.7 degrees, 0.4 degrees above the 1991–2020 average and tied for the 46th warmest on record going back to 1895. The preliminary statewide average total May precipitation was 2.71 inches, 2.06 inches below the 1991–2020 average and the 28th driest on record statewide.

Data are provisional and may change slightly over time.

Colder Start and Warmer End to May

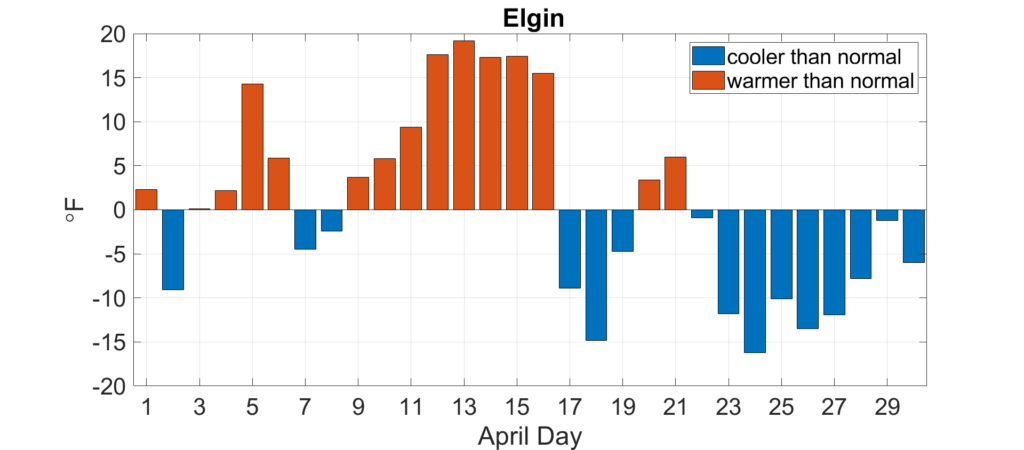
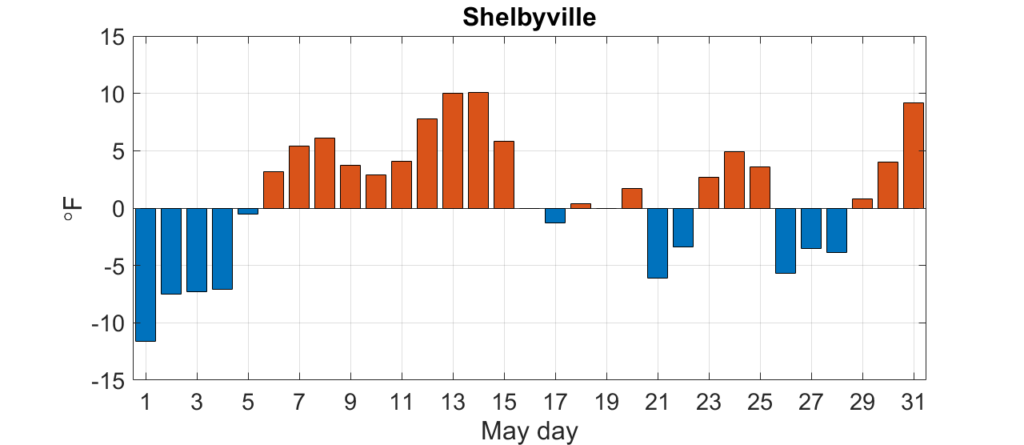
Even though June is the first month of climatological summer, we typically get our first real taste of summer weather in May. Daily May temperature departures from normal in Shelbyville (Figure 1) show extended periods of above normal temperatures last month, especially in the second and fourth weeks. Several places in the state hit the low 90s multiple times, including 94 degrees in Normal and 93 degrees in Moline on May 31.

Figure 1. Daily May average temperature departures in Shelbyville.

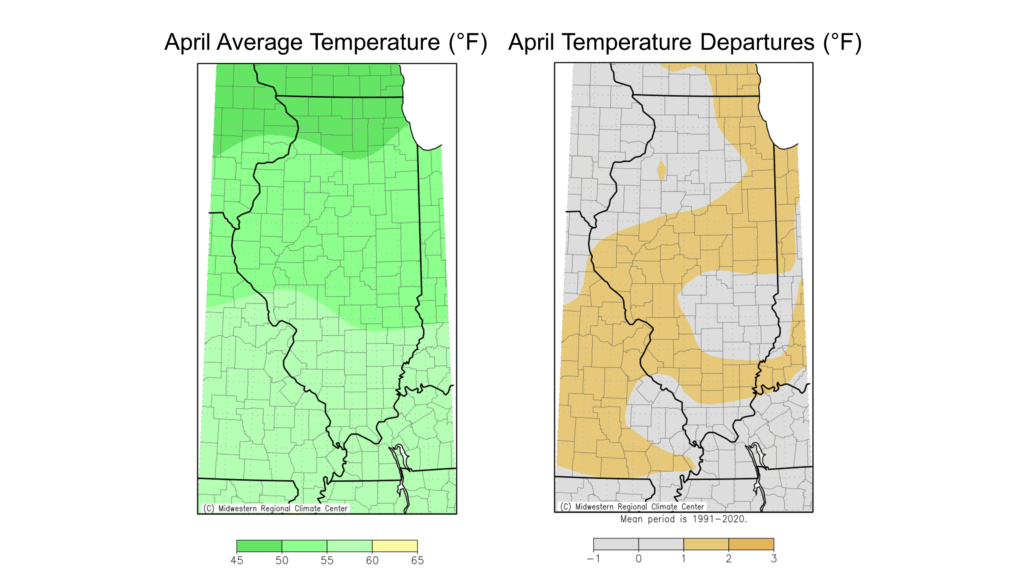
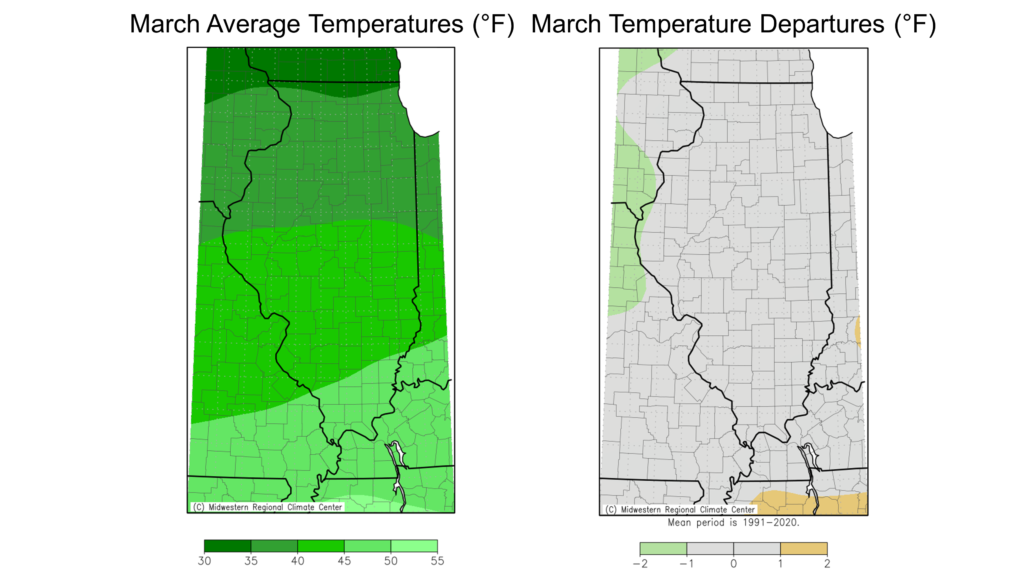
May average temperatures ranged from the high 50s in northern Illinois to the high 60s in southern Illinois, between 1 and 3 degrees above normal (Figure 2). The cooler start to the month and dry air over Illinois allowed nighttime low temperatures to regularly dip into the 40s. Parts of central and northern Illinois even saw the low 30s on a few nights in early May, including 30 degrees in Normal and Marseilles. The warmest point in the state last month was Cahokia at 67.6 degrees, and the coolest was Waukegan at 56.9 degrees.

Figure 2. Maps of (left) May average temperature and (right) May average temperature departures from normal.

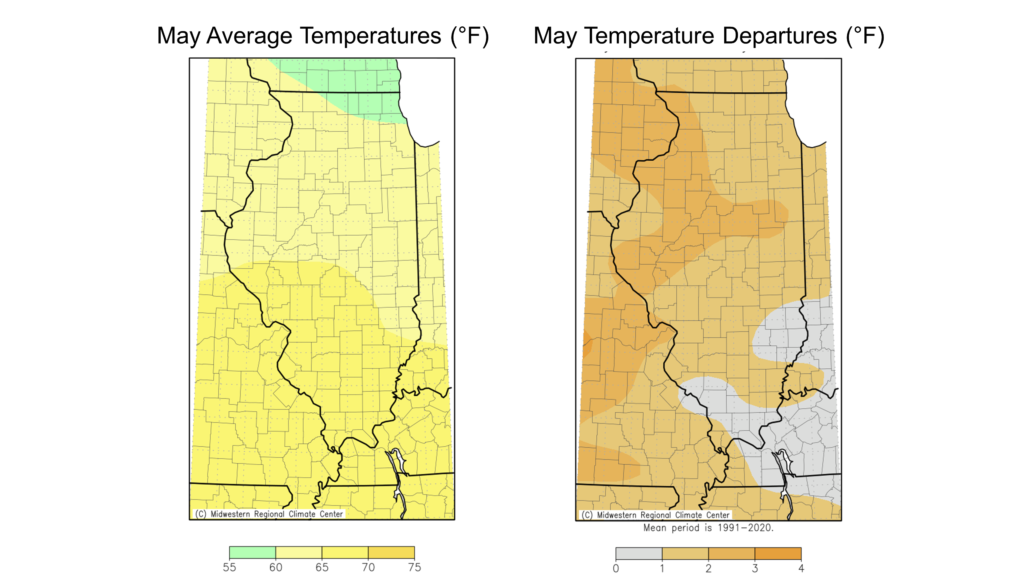
Overall, the preliminary statewide average May temperature was 63.7 degrees, 0.4 degrees above the 1991–2020 average and tied for 46th warmest on record going back to 1895.

Dry May for Most

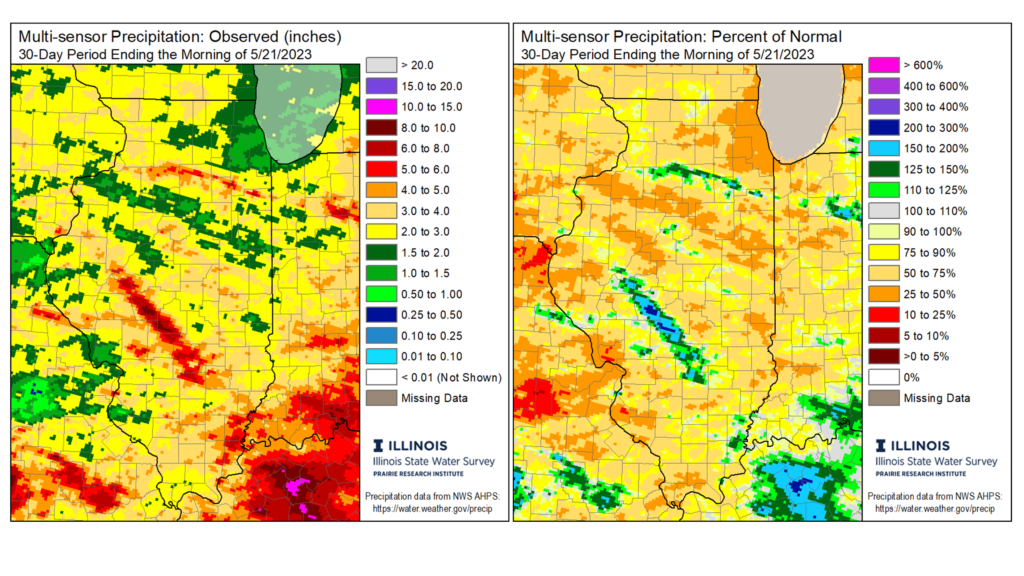
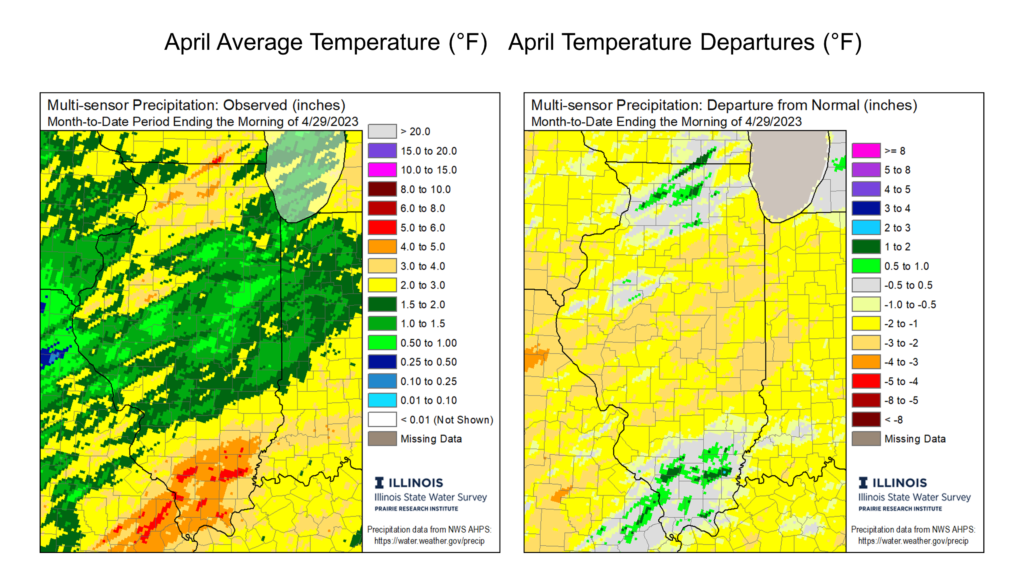
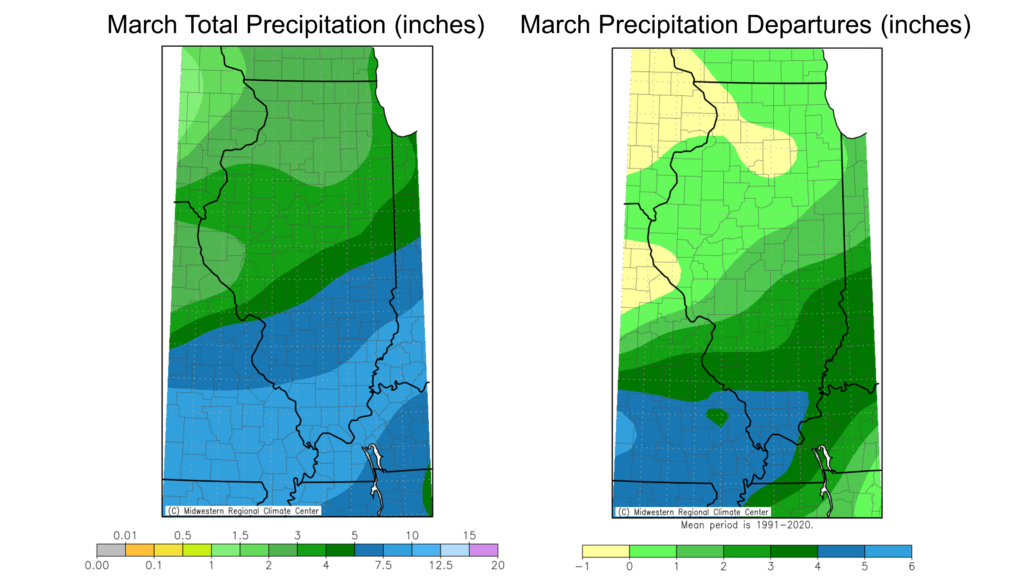
May is the climatological third wettest month of the year for the state of Illinois, just behind June and July. Unfortunately, last month did not bring the typical May showers for most of the state, continuing a dry pattern from April. May total precipitation ranged from nearly 10 inches in isolated parts of central Illinois to less than 1 inch in northeast Illinois. While small parts of central Illinois picked up 2 to 4 inches above normal May rainfall–mainly from one or two storm systems–most of the state ended the month between 1 and 4 inches drier than normal (Figure 3).

Figure 3. Maps of (left) May total precipitation and (right) May precipitation departures from normal.

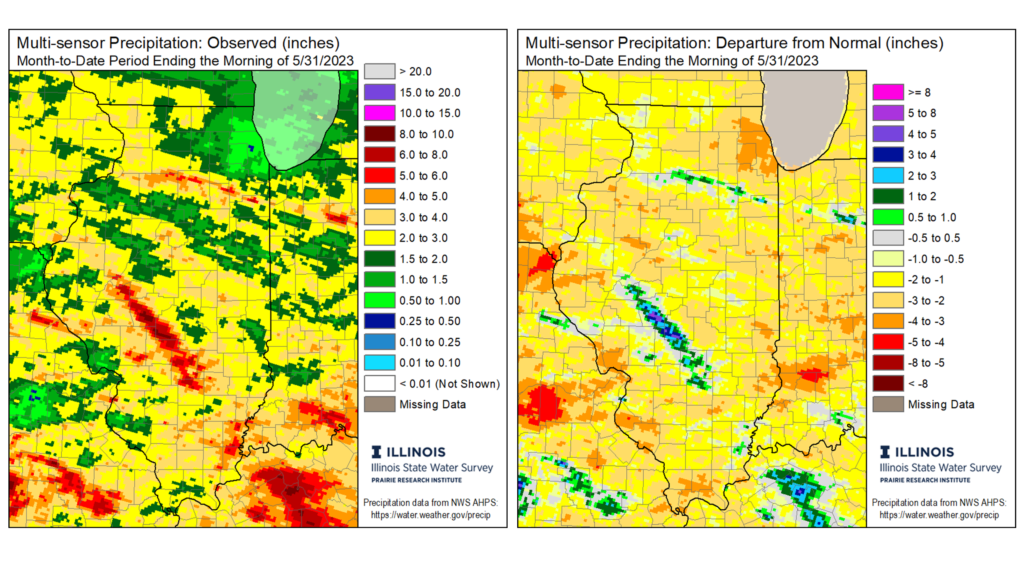
The dryness last month was most intense along the Missouri border and in northeast Illinois, where many places had less than 1 inch of total rainfall. Chicago had only 0.71 inches last month, making it the fourth driest May on record there. The combination of well below normal precipitation in April and May was also remarkable. Quincy had only 3.01 inches of rain between April 1 and May 31, which was the third lowest total on record there for that period. The months of April and May together were also the eighth driest on record in Chicago and the ninth driest on record in Champaign. Meanwhile, a series of storms produced very heavy rain across a small stretch of central Illinois, with one-day total exceeding 8 inches in Sangamon and Christian counties. The wettest point in the state last month was Morrisonville in Christian County with 12.25 inches, making it the wettest May on Morrisonville’s 40+ year record.

Overall, the preliminary statewide average total May precipitation was 2.71 inches, 2.06 inches below the 1991–2020 average and the 28th driest on record statewide.

Drought in Illinois

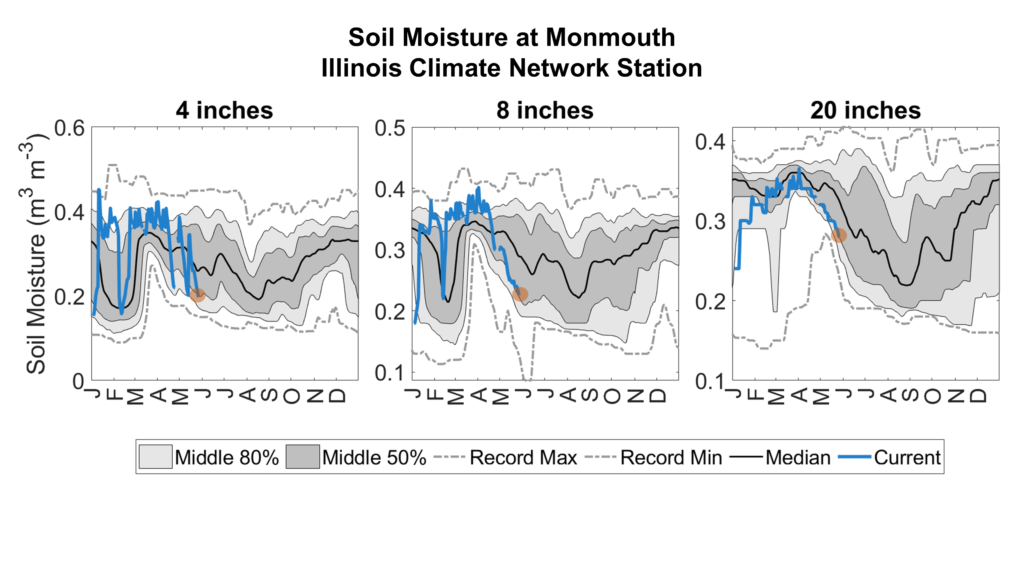
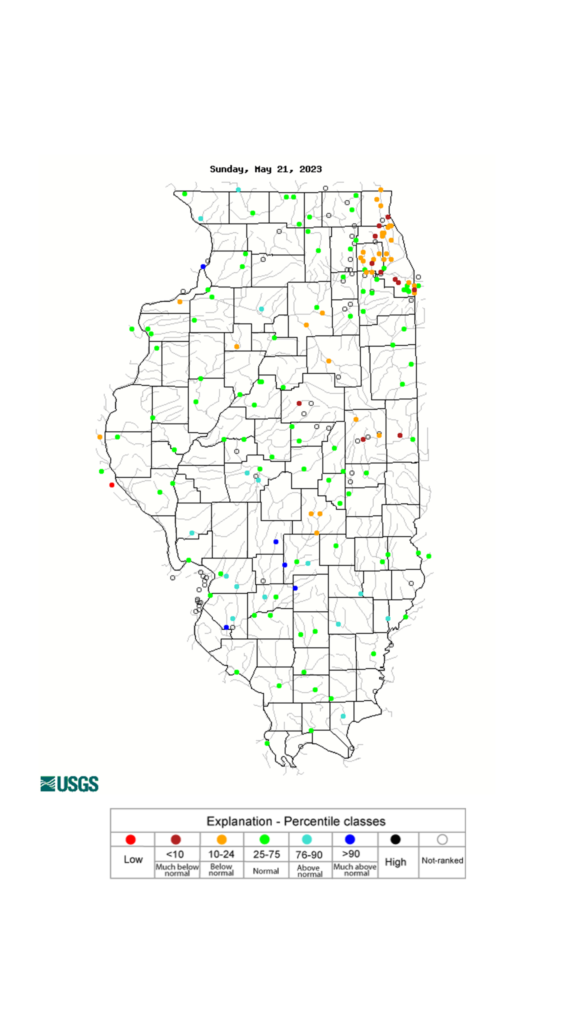
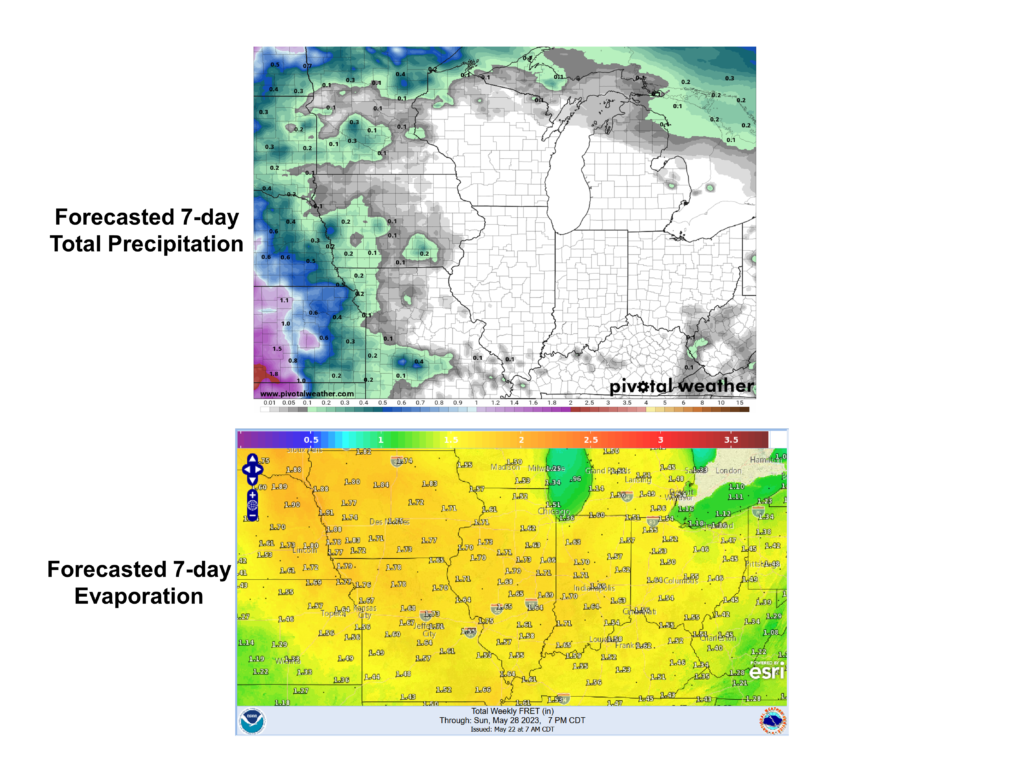
The combination of drier than normal conditions in April and May and warmer than normal weather throughout much of the past three weeks has taken a significant toll on our soil moisture and streamflow. Soils throughout the state are somewhat to much drier than normal down to 8 to 10 inches and drying quickly. Streamflow in many streams in northern and central Illinois is well below normal for the start of summer. Impacts so far have been isolated to drying lawns and stressed shrubs and young trees; however, there is a concern of increased or worsening impacts if dry and hot weather continues into June. The most recent U.S. Drought Monitor map shows much of central and northeast Illinois is in moderate drought, and most of the northern two-thirds of the state is at least considered abnormally dry (Figure 4).

Figure 4. The U.S. Drought Monitor map current as of May 30.

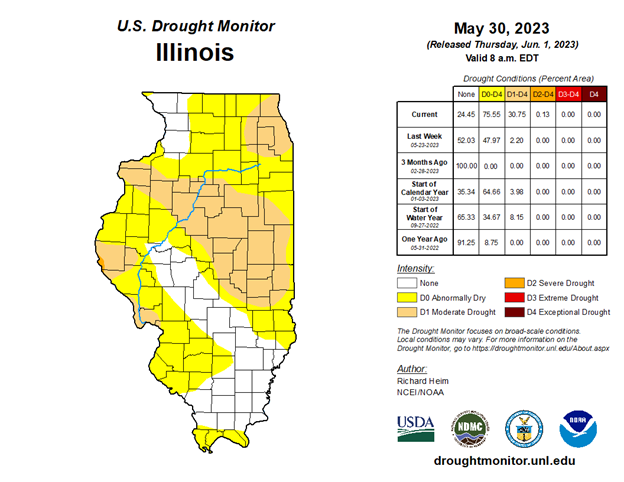
We have received dozens of condition and impact reports over the past week in Illinois, which has helped tremendously with drought monitoring. Examples of impacts reported included some visible drought stress in soybeans in Moultrie County, corn that is struggling to emerge in Monroe County, and completely dormant grass in Marshall County. While most of these impacts so far have been on the mild side, there is increased concern because they are occurring early in the growing season. With the heat of summer approaching (or here, in some places), continued dryness in June would likely worsen impacts to ecology, agriculture, and water resources.

Please continue to report conditions and impacts using the National Drought Mitigation Center’s CMOR system: https://droughtimpacts.unl.edu/Tools/ConditionMonitoringObservations.aspx.

Spring in Illinois

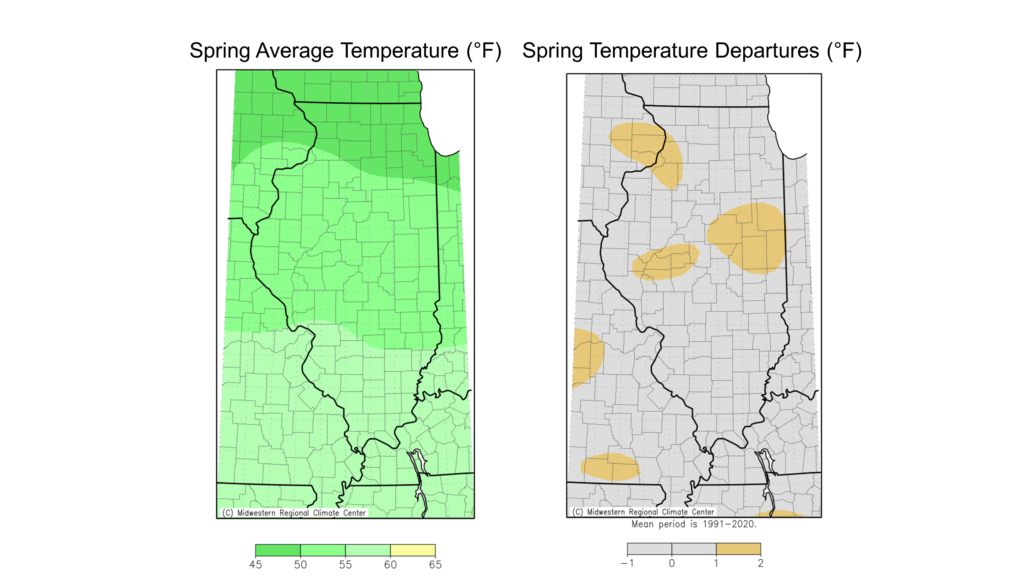
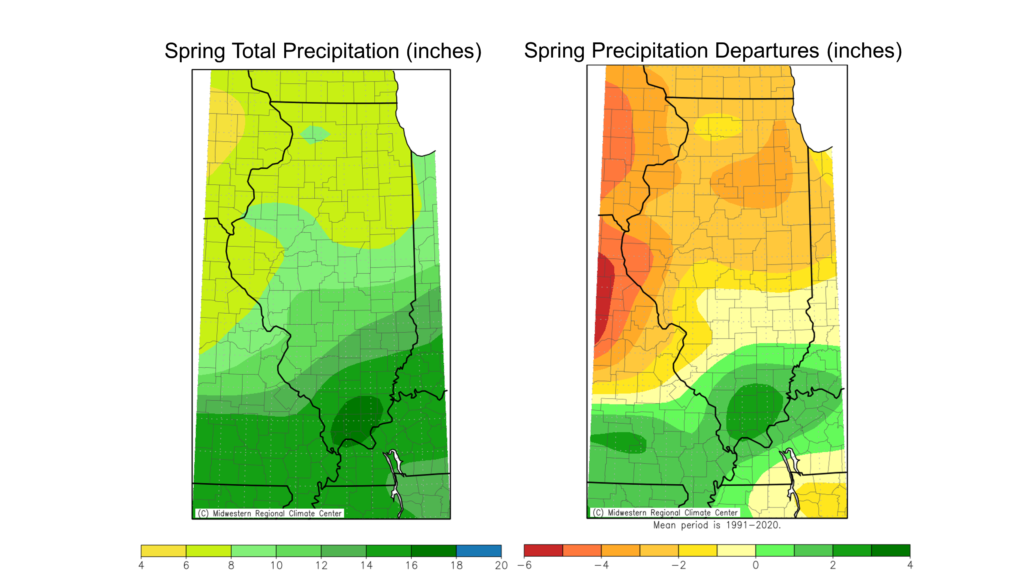
Climatological spring encompasses March, April, and May, and offers hope that the cold of winter will end with the beginning of warmer weather. Temperature-wise, this spring was very close to the 30-year normal, with average temperatures between the high 40s in northern Illinois and the mid-50s in southern Illinois (Figure 5a). However, spring precipitation varied quite a lot depending on where you were in the state. Climatological spring precipitation exceeded 16 inches in parts of southern Illinois and was 1 to 3 inches wetter than normal for virtually all places south of Interstate 65. Meanwhile, spring totals in central and northern Illinois ranged from 5 to 12 inches, between 1 and 4 inches drier than normal (Figure 5b).
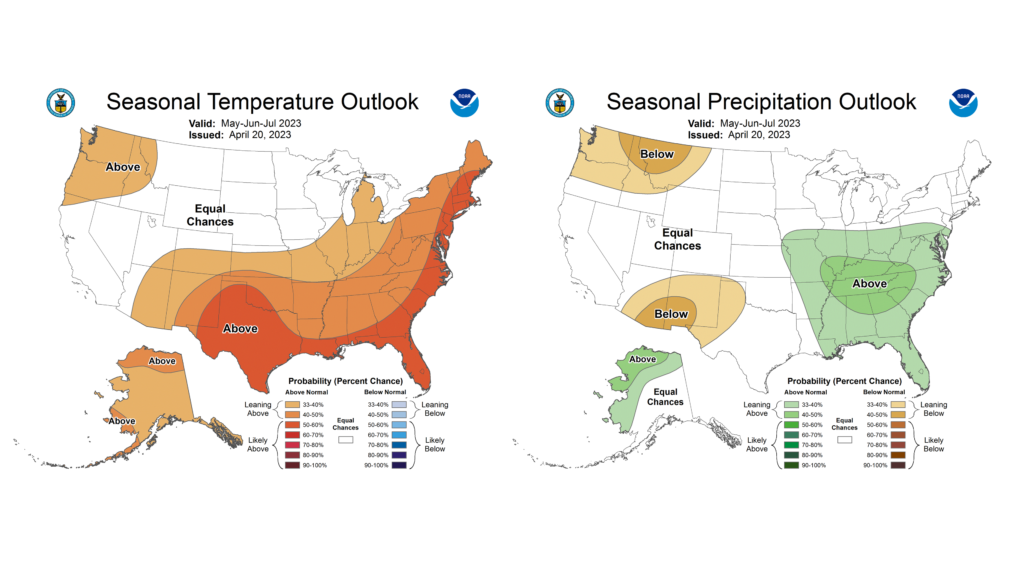
Figure 5. Maps show (top) average temperature and departures from normal and (bottom) total precipitation and departures from normal for climatological spring (March–May).

Outlooks

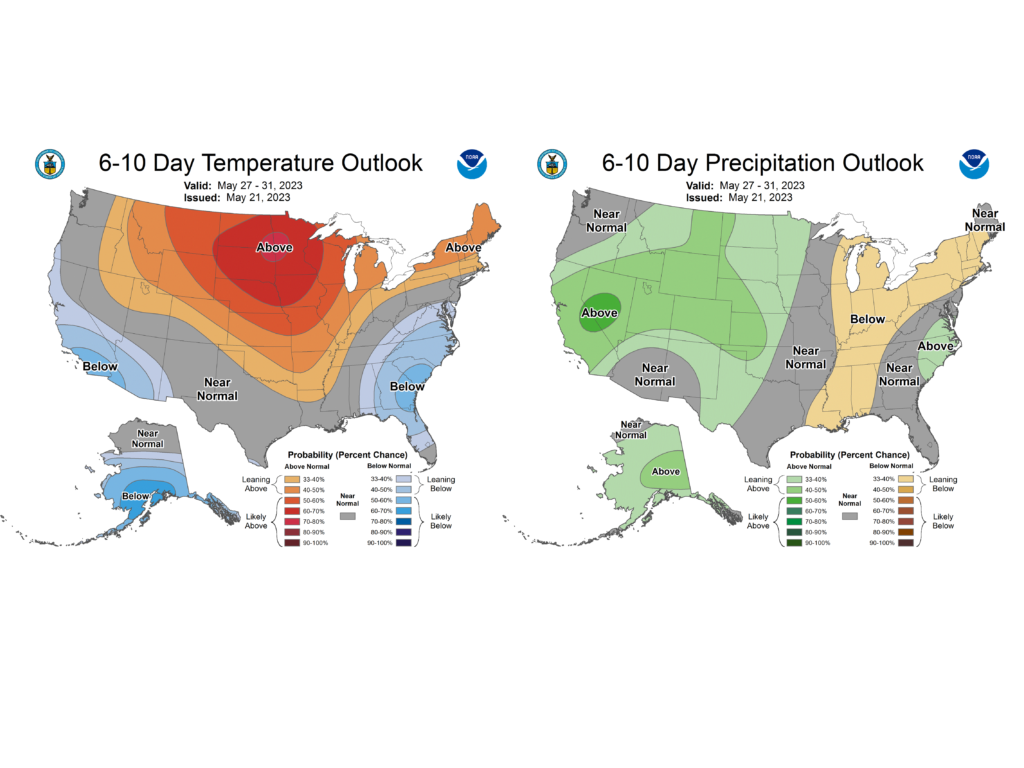
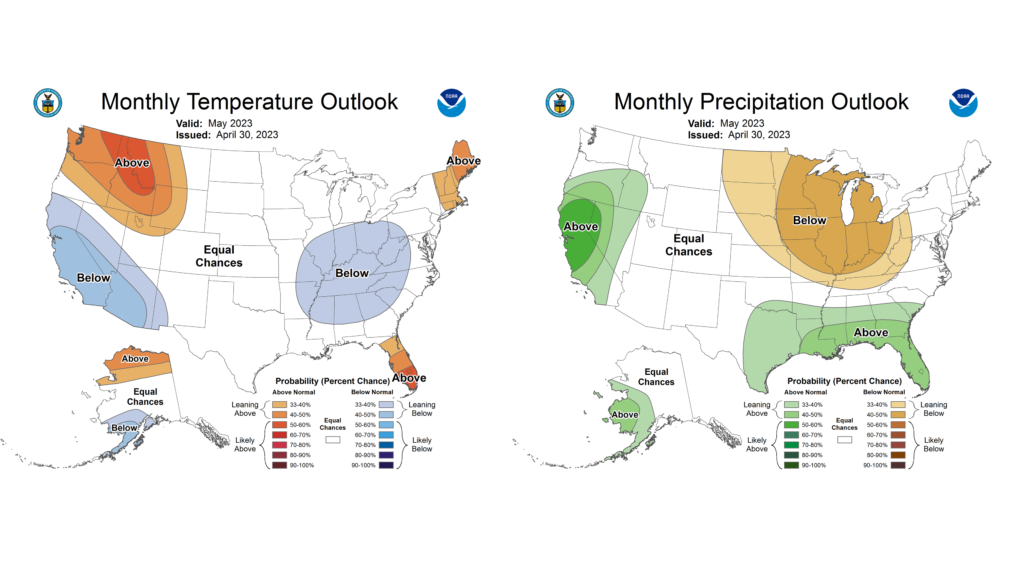
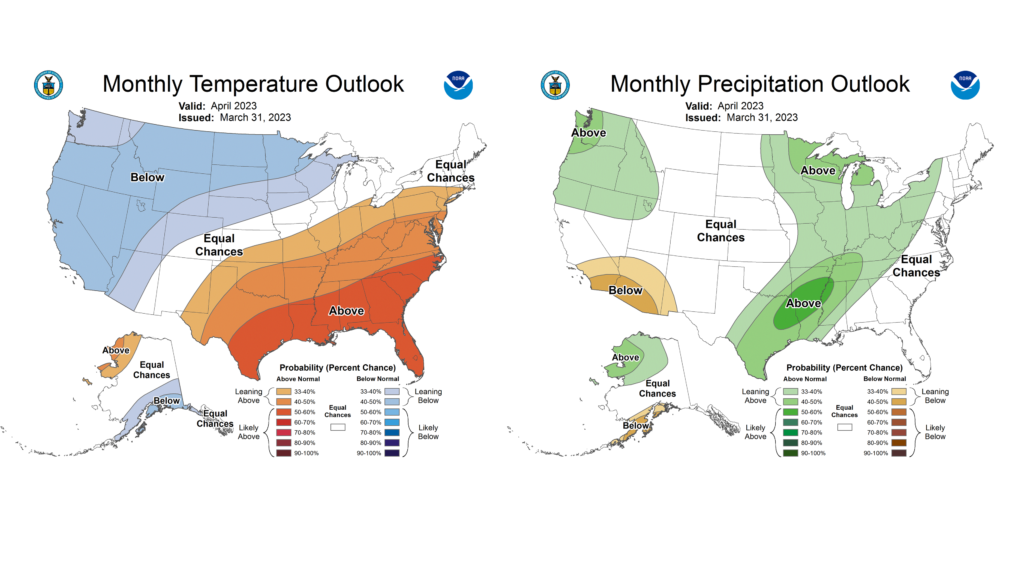
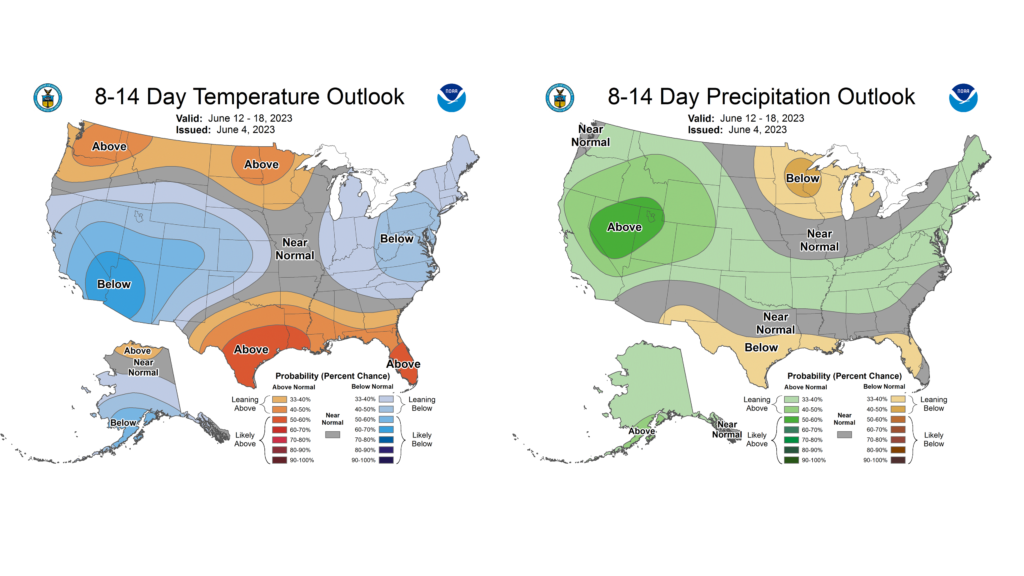
June ushers in climatological summer, and we start the month of June hoping for a little more rain. Models have been signaling a potential pattern shift around June 15–18, and outlooks for the second to third weeks of the month show the highest chances of near to below normal temperatures and near normal precipitation (Figure 6). June brings, on average, about 1 to 1.25 inches of rain each week in Illinois, so even near normal rainfall in mid-June would be much wetter than what we’ve seen lately.

Figure 6. Maps show (left) temperature and (right) precipitation outlooks for the second to third weeks of June.

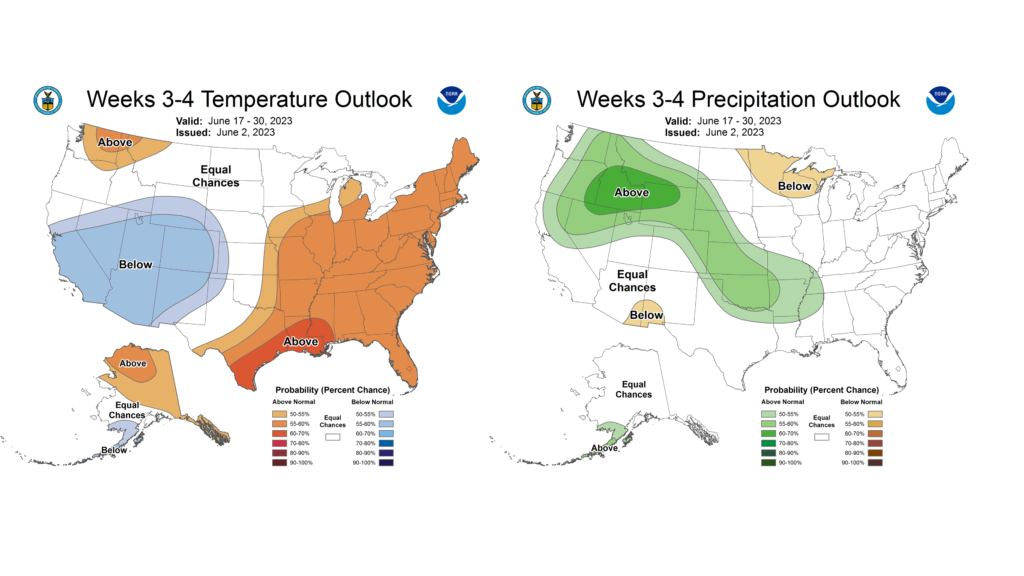
The week three and four outlooks indicate a shift back to above normal temperatures but continues near normal precipitation (Figure 7). It will take more than a few wetter-than-normal weeks to remove drought entirely in Illinois, but timely June rain will go a long way to staving off further ecological, agricultural, and water resource impacts.

Figure 7. Maps show (left) temperature and (right) precipitation outlooks for the latter half of June.

Increased Risk of Drought Conditions in Illinois

Parts of northeast, western, and central Illinois have been much drier than normal in the past 4 to 6 weeks, causing dry soils and lower streamflow. Perennials, gardens, and young trees in these areas have begun to show some response to the dryness, requiring more frequent watering than typical for late May. Forecasts for the next 7 to 10 days show very dry weather and above normal temperatures, which will likely worsen already dry conditions in the state and potentially induce rapid onset drought conditions in some areas.

As conditions evolve, accurate reports on conditions and drought impacts are critical to accurately assess what parts of the state are in drought and what parts are not. Whether your area is currently wet, close to normal, or dry, please consider reporting conditions and any drought impacts you see or hear via the National Drought Mitigation Center’s Condition Monitoring Observer Report (CMOR, https://droughtimpacts.unl.edu/Tools/ConditionMonitoringObservations.aspx) system or by email to the State Climatologist Office (statecli@isws.illinois.edu). 

Current & Recent Dryness

A dry pattern has been in place over Illinois since mid-April. Outside of a few areas of heavy rain, most places have had between 60% and 90% of normal precipitation in the last 30 days (Figure 1). Parts of central and western Illinois, the St. Louis Metro East, and virtually all of Chicagoland have had less than 50% of normal rainfall since April. As of May 22nd, Chicago has had only 0.42 inches of total May precipitation, more than 2 inches below normal by this time in May.

Figure 1. Maps show (left) total precipitation and (right) precipitation percent of normal over the last 30 days.

The combination of dryness and above average temperatures in May increased evaporation and plant water use, which depleted soil moisture. Figure 2 shows much drier than normal soils at 4-, 8-, and 20-inch depths at Monmouth, as part of the Illinois Climate Network. As of May 22nd, the top 20 inch soil column at Monmouth has 1-1.5 inches less water in it than normal for late May, meaning less water available for plant and crop use.

Figure 2. Soil moisture conditions (blue line) at the Monmouth Illinois Climate Network station. The red dots show current soil moisture levels compared with the average (black line) for this time of the year.

The lack of consistent rain and dry soils have acted together to reduce levels in some streams and rivers across northeast, central, and western Illinois (Figure 3). The orange and red dots in Figure 3 show places where stream levels are somewhat- to much-lower than normal for late May. Several streams in northeast and east-central Illinois have seen flow dip well below normal this month, including the Vermilion River at Pontiac and Lenore, the Illinois River at Marseilles and Henry, and the Sangamon River at Fisher and Monticello.  

While the recent dryness is beginning to affect stream levels in Illinois, drought has not persisted enough to significantly affect water resources. Drought in Illinois typically impacts plants and crops first, as soil moisture is depleted; but can begin to impact water resources and water quality if it persists.

Figure 3. Map shows 7-day average streamflow across Illinois. Orange and red dots show stream levels that are well below normal for late May.

Dry & Warm End to May

Current conditions show only small parts of Illinois are experiencing drought, although soils are drier than normal across much of central and northern Illinois, and streamflow is declining in these areas. The 7-day forecast from the National Weather Service shows very little – if any – rainfall across Illinois this week (Figure 4). Meanwhile, temperatures are expected to reach into the mid-80s and may even crack 90 degrees in some places this week and into next week. The result of higher temperatures and low humidity is increased evaporation and transpiration, which further deplete soil moisture. As Figure 4 shows, National Weather Service forecasts show between 1.5 and 1.75 inches of potential evaporation over the next 7-days, meaning the state would generally need that much rainfall to keep soil moisture conditions steady.

Figure 4. Maps show (top) forecasted 7-day total precipitation and (bottom) forecasted 7-day total evaporation aross the Midwest. Forecasts come from the National Weather Service Weather Prediction Center.

The NOAA Climate Prediction Center outlooks for the final week of May also lean warmer and drier than normal across the state. A potentially very dry and warm end to May would likely worsen already dry conditions, and push more of the state into drought, with potential impacts to perennials, vulnerable crops, and young trees. The Climate Prediction Center has also denoted a swath of the eastern corn belt that is at risk of rapid-onset or “flash” drought in the next 2 weeks because of the expected warmer and drier conditions (Figure 6).

Figure 5. The top maps show (left) temperature and (right) precipitation outlooks for the last week of May, indicating likely warmer and drier than normal conditions across Illinois. The bottom map shows the risk of rapid onset drought across parts of Illinois, Indiana, and Ohio over the next 2 weeks according to the Climate Prediction Center.

What Can I do?

Drought is a tough hazard because of its relatively slow evolution (as compared to a tornado or blizzard, for example) and its complex impacts; however, there are important steps we can take before and during drought to minimize its impacts. The first impacts we typically see with drought are to vulnerable perennials, crops, and young trees. Folks should be extra aware of how dry soils are in their areas, and if possible, augment watering of sensitive shrubs, trees, and other perennials – especially if they begin to show water stress. Additionally, we should always conserve water and use it sustainably, but particularly so when in drought. While no water resource impacts have been reported in Illinois from the recent dryness, our water use can affect the severity of drought impacts.

Lastly, monitoring drought conditions across Illinois is challenging and time consuming because of its varied and sometimes subtle impacts. Likewise, it is just as important to know where drought is not as to know where drought is. Therefore, to help with the drought monitoring and impact assessment process, please consider regularly reporting conditions and any impacts (or lack thereof) in your part of the state. Reports can include how wet or dry is the environment around you (soils, lawn, gardens, etc.), are you seeing any impacts like trees drooping or dropping leaves and are creek- and stream-levels in your area near normal, above normal, or below normal for this time of the year.

Impact reports can be submitted through:

The National Drought Mitigation Center’s Condition Monitoring Observer Reporting (CMOR) system: https://droughtimpacts.unl.edu/Tools/ConditionMonitoringObservations.aspx,

or via email to the Illinois State Climatologist Office: statecli@isws.illinois.edu.

Also, if you observe precipitation for CoCoRaHS, please consider submitting a weekly condition monitoring report: https://www.cocorahs.org/content.aspx?page=condition. Every report makes a difference, and helps us understand drought conditions and can help direct help and resources where they need to go in the state.  

Warmer and Drier April in Illinois

The preliminary statewide average April temperature was 53.0 degrees, 0.4 degrees above the 1991–2020 average and tied for 43rd warmest on record going back to 1895. The preliminary statewide average total April precipitation was 2.75 inches, 1.49 inches below the 1991–2020 average and 37th driest on record statewide.

Data are provisional and may change slightly over time.

Typically Mixed April Temperatures

April is the definition of a transition month as we move from winter into summer, and therefore we can get a taste of either season in April. This past month gave us a look ahead to summer with temperatures that were 15 to 20 degrees above normal in the first half of the month, only to remind us what April can do in Illinois, with temperatures 10 to 15 degrees below normal in the last half of the month. Daily average temperature departures from normal in Elgin (Figure 1) show the roller coaster that was April.

Figure 1. Daily April average temperature departures in Elgin.

April average temperatures ranged from the high 40s in northern Illinois to the high 50s in southern Illinois, less than 2 degrees above normal statewide (Figure 2). The warmer first half of the month broke 33 daily high maximum temperature records in Illinois and 15 daily high minimum temperature records. Olmstead Lock and Dam in Pulaski County in southern Illinois reached a high of 91 degrees on April 6, which broke its all-time April temperature record of 89 degrees. This record is particularly impressive because it was set in the first week of April, whereas most April high temperature records occur toward the end of the month. The cooler end to the month broke 22 daily low maximum temperature records but no daily low minimum temperature records.

Figure 2. Maps of (left) April average temperature and (right) April average temperature departures from normal.

Overall, the warmer start to the month slightly outweighed the cooler end, and April ended slightly warmer than normal statewide. The preliminary statewide average April temperature was 53.0 degrees, 0.4 degrees above the 1991–2020 average and tied for the 43rd warmest on record going back to 1895.

April Showers (for some)

April is typically associated with spring showers on early blooming flowers. The flowers came last month, but the showers were harder to find in some parts of the state. In fact, the first half of the month was very dry, and the week of April 8 to 13 was completely dry across the entire state. The last time the entire state measured exactly 0 inches of precipitation for a full 7 days was November 11–17, 1999, and it looks like that week last month may be one of–if not the only–completely dry April week on record in Illinois. It is very rare to have such a dry spell in spring in Illinois. Combined with the unusually high temperatures and very low humidity, the dry weather in early April had folks summer dreaming, and had farmers clamoring to get as much work done as possible.

The latter half of the month was wetter and cooler but did not make up for the very dry start to the month. Total April precipitation ranged from nearly 8 inches in parts of southern Illinois to around 1 inch in parts of east-central Illinois (Figure 3). Although most of southern Illinois and parts of northern Illinois were near to 1 inch wetter than normal, virtually everywhere between interstates 70 and 80 were 1 to 3 inches drier than normal last month.

Figure 3. Maps of (left) April total precipitation and (right) April precipitation departures from normal.

We have seen drier Aprils before, and this month was not record-breaking. However, it was the 18th driest April on record in Champaign (1.68 inches). Overall, the preliminary statewide average total April precipitation was 2.75 inches, 1.49 inches below the 1991–2020 average and the 37th driest on record statewide.

The Snow No One Wants

The wonderful diversity we enjoy here in Illinois sometimes brings about conflicting opinions and preferences, including on food, music, recreation, etc. But one thing that unites us as Illinoisans is strong disdain for April snow. By mid-April we are ready for summer, sunshine, and wearing only one layer of clothes. So, it’s less than ideal when a beautifully warm start to April–as we had last month–is followed by a dramatic cool down and snow showers in some places.

Figure 4. Maps show (left) April snowfall totals and (right) April snowfall departures from normal.

The northern third of the state picked up between 0.10 and 2 inches of snow last month, slightly more than normal in northwest Illinois and near to slightly less than normal in northeast and north-central Illinois (Figure 4). The central and southern parts of the state were spared the white stuff, although trace amounts of snowfall were reported as far south as Decatur in mid-April.

April reinforced snowfall patterns through this past snow season, namely a lot of snow for northwest Illinois and much less for everyone else. Season total snowfall (since October 1) ranged from over 50 inches in far northwest Illinois to less than 7 inches in parts of central Illinois. In fact, virtually all of southern Illinois, including the area right along the Ohio River, picked up more snow this past season than parts of central Illinois. The northwest corner of the state had 5 to 10 inches above normal snowfall, and southern Illinois was within 5 inches of normal. Meanwhile, most of the state from Chicago to St. Louis was 10 to 15 inches below normal on snowfall this season (Figure 5).

Figure 5. Maps show (left) season-total snowfall and (right) season snowfall departures from normal.

This past snowfall season, from October 1 to April 30, was the third least snowy on record in Springfield (6.3 inches) and the second least snowy on record in Champaign (7.0 inches). I will take the blame for this past season’s paltry snow totals in central Illinois, because I bought a nice, new sled last summer.

Outlooks

Even though April can give us a taste of summer, May is the first month when we really experience summer weather. Last year, May brought us a very early heat wave and prolonged summer-like temperatures. However, the initial outlook from the Climate Prediction Center for May shows higher chances for below normal temperatures across much of the state (Figure 6). Also interesting are the widespread higher chances for below normal precipitation.

Figure 6. Maps show (left) temperature and (right) precipitation outlooks for May.

The expected pattern flips for the three-month outlooks from May through July, with higher odds of above normal temperatures and precipitation in Illinois (Figure 7). The apparent contrast between May and May–July outlooks suggests a wetter start to summer following a possibly drier May.

Figure 7. Maps show (left) temperature and (right) precipitation outlooks for May–July.

A Cooler and Wet Start to Spring

The preliminary statewide average March temperature was 40.5 degrees, 0.6 degrees below the 1991–2020 average and the 68th coolest on record going back to 1895. The preliminary statewide average total March precipitation was 4.46 inches, 1.24 inches above the 1991–2020 average and the 23rd wettest on record statewide.

Data are provisional and may change slightly over time.

Spring-ish

Outside of a short but intensely cold period in mid-March, last month wasn’t abnormally cool. However, given it followed a top 20 warmest winter on record statewide, March felt to this climatologist as more of an extension of winter than a start to spring. Daily temperature departures from normal in Carbondale show a warmer beginning and end to the month, with a 10-day period of mostly below normal temperatures in the middle (Figure 1). Temperatures between March 12 and 21 were 8 to 15 degrees below normal across the state. Actual temperatures in mid-March dipped as low as 2 degrees in Menard County and 6 degrees in Will County.  

Figure 1. Daily March average temperature departures in Carbondale.

March average temperatures ranged from the low 30s in far northern Illinois to the high 40s in southern Illinois, within 1 degree of normal virtually everywhere (Figure 2). The cooler weather last month broke X daily high maximum temperature records and X high minimum temperature records. Additionally, X daily low maximum temperature records and X daily low minimum temperature records were broken in March.

Overall, the preliminary statewide average March temperature was 40.5 degrees, 0.6 degrees below the 1991–2020 average and the 68th coolest on record going back to 1895.

Figure 2. Maps of (left) March average temperature and (right) March average temperature departures from normal.

Wet & Active Start to Spring

Both January and February were wetter than normal statewide, and March followed the same pattern. Most of last month saw an active storm track and many low-pressure systems running through the Midwest. Most of Illinois remained in the rain portions of these systems, bringing multiple rounds of rainfall–occasionally heavy–to the state. Total March precipitation ranged from just over 3 inches in northwest Illinois to nearly 12 inches in far southern Illinois (Figure 3). While the northern third of the state was around 1 to 2 inches wetter than normal last month, parts of central and southern Illinois were 3 to 6 inches wetter than normal.

Last month was the 5th wettest March on record in Paducah, Kentucky. The first quarter of 2023 has been a top 10 wettest start to the year in Paducah (5th wettest) as well as in Chicago (4th wettest), Rockford (6th wettest), and Peoria (10th wettest). The preliminary statewide average total March precipitation was 4.46 inches, 1.24 inches above the 1991–2020 average and the 23rd wettest on record statewide.

Figure 3. Maps of (left) March total precipitation and (right) March precipitation departures from normal.

Unfortunately, the frequent precipitation also came along with some severe weather, especially in the last week of the month. A strong system came through the Midwest the final day of the month, producing dozens of tornadoes, hail, and widespread straightline wind gusts exceeding 60 to 70 mph. Significant damage occurred to multiple towns in Illinois that evening, including in Sherman in Sangamon County and Robinson in Crawford County (Figure 4). Among several injuries, three fatalities were reported from the initially rated EF-3 tornado in Crawford County. Additionally, wind gusts exceeding 90 mph were reported in parts of LaSalle and Grundy Counties in northern Illinois and resultant damage reports to buildings and trees. While the exact number of tornadoes on March 31st will be made official later this year, Illinois has likely seen close to the total number of tornadoes it experienced in all of 2022 (37). In fact, through April 1st there have been 200 severe thunderstorm or tornado warnings issued by National Weather Service Offices for Illinois this year, second only to 2006. By this time of the year in 2022, the state had only had 56 severe thunderstorm or tornado warnings

Figure 4. Photo of damage at Robinson Municipal Airport in Crawford County (source: NWS Lincoln, IL).

Snow for Thee, Not for Me

Very few folks in Illinois cheer at the sight of late-March snow; however, following the decidedly weak winter we experienced across the state, a stray snow shower would not be amiss in central Illinois. However, as the active storm track carried multiple systems through the Midwest in March, the dividing line between rain and snow seemed locked into northern Illinois. Folks along and north of Interstate 88 saw quickly accumulating wet and heavy snowfall, while areas south mostly got rain.

Overall, only the northern half of the state saw any snowfall last month, with totals ranging from less than half an inch along Interstate 70 to nearly 15 inches in northwest Illinois. Moline’s 10.6 inches last month was the most March snow there since 2013.Rockford’s 14.1 inches was the most March snowfall there since 1972. But the big “winner” last month for snowfall was Freeport, with a whopping 14.5 inches, the fifth most March snowfall on record there back to 1943.

As Figure 5 shows, above normal snowfall in March in northwest Illinois has pushed the 2022-23 season-to-date snowfall 2 to 8 inches above normal, while the rest of the state has seen between 2 and 15 inches below normal snowfall this season. The snowfall deficits have been especially large this season in parts of central and northeastern Illinois. For example, if Springfield sees no additional snow before May, it will be the third lowest seasonal total on record (6.3 inches), and the lowest since 1954. It is the same story in Champaign, whose 7 inches so far this season would be the second lowest on record if no additional snowfall is measured before May. Both stations’ records go back to at least the late 1800s.  

Figure 5. Maps show (left) March snowfall totals (middle) March snowfall departures from normal, and (right) winter season to date snowfall departures.

Outlooks

April is an eternally optimistic month full of celebration, reflection, and wonderful spring color. It’s also an important month for agriculture and spring flooding, and a mild, drier April can help with both. The latest April outlooks from the Climate Prediction Center lean warmer and wetter than normal for the month (Figure 6). If wetter conditions do prevail this month–and with a very healthy snowpack present in the Upper Midwest–we’ll need to watch carefully for the risk of spring flooding, especially along the mainstem Mississippi River. 

Figure 6. Maps show (left) temperature and (right) precipitation outlooks for April.

The three-month outlooks for April through June look similar, leaning to warmer and wetter than normal conditions across much of the state (Figure 7). The wetter outlook does not necessarily spell planting delays in Illinois, but it does suggest the windows of opportunity for spring fieldwork may be unusually tight.

Figure 7. Maps show (left) temperature and (right) precipitation outlooks for April – June.