July Brought Sweetcorn… and Floods, Drought, Heat, Smoke, and Tornadoes

The preliminary statewide average July temperature was 75.3 degrees, 0.1 degrees below the 1991–2020 average and tied for 64th warmest on record going back to 1895. The preliminary statewide total July precipitation was 5.08 inches, 1.02 inches above the 1991–2020 average and the 22nd wettest on record.

Data are provisional and may change slightly over time.

Mostly Mild July Capped by Big Heat

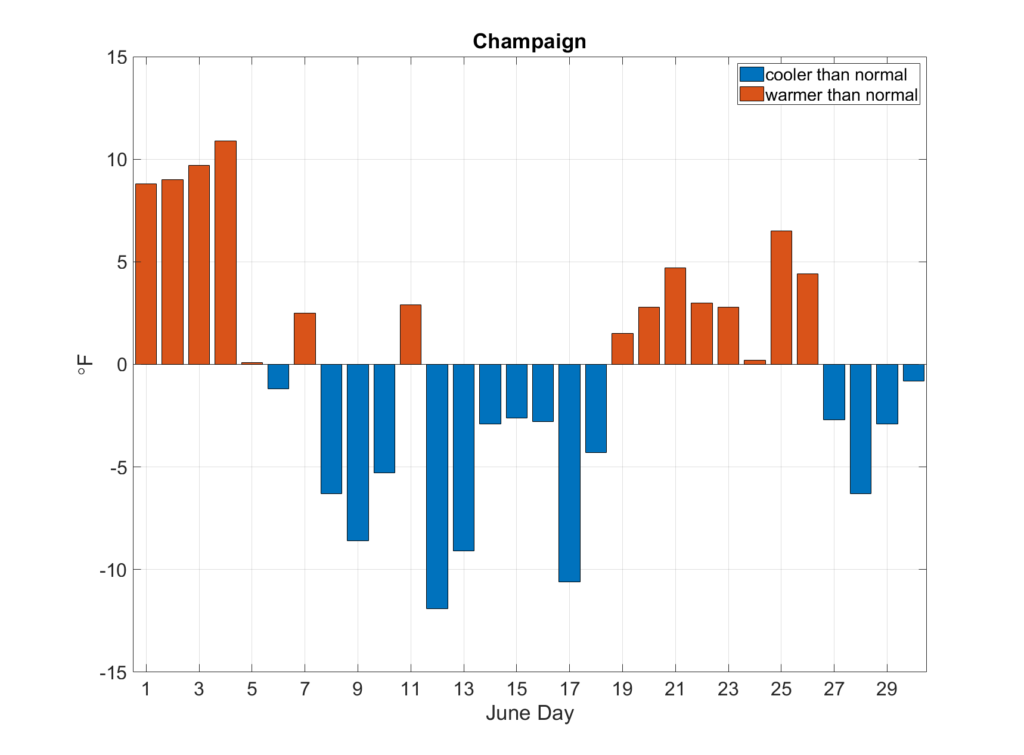
July began with a mix of slightly warmer conditions followed by a prolonged period of near to below normal temperatures. Temperature departures from Dixon showed a nearly three-week period where all but one day was cooler than normal in the middle of July (Figure 1). A large ridge over the southwest U.S. that kept a pleasant, northwest flow of cooler air into the Midwest for most of the month opened in the last week of July, building intense heat across the region between July 26 and 29. More details on the late July heatwave follow.

Figure 1. Daily July average temperature departures in Dixon.

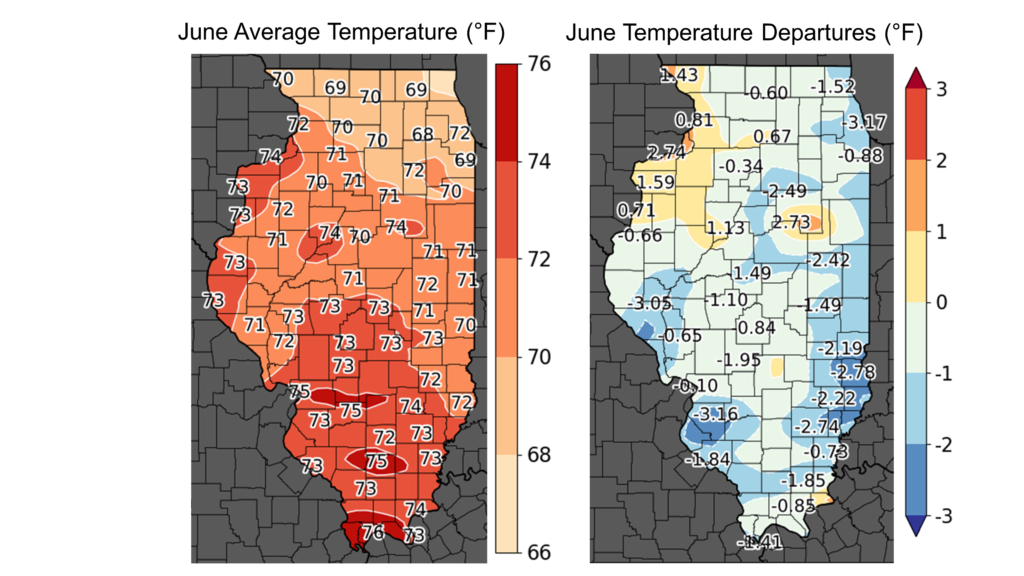
July average temperatures ranged from the low 70s in northern Illinois to the high 70s in southern Illinois, within 1 degree of normal virtually everywhere (Figure 2). The welcomed lack of humidity in the first two-thirds of the month allowed nighttime low temperatures to regularly dip into the low 60s and even 50s in some parts of the state. July nighttime lows included 51 degrees in Aurora, 53 in Chenoa, and 54 in Ottawa. Daily high temperatures were closer to normal, but rarely exceeded 90 degrees in the northern two-thirds of the state through most of July. The coolest place in the state last month was Stockton in Jo Daviess County with an average temperature of 70.5 degrees, and the warmest place in the state in July was Cahokia with an average temperature of 79.8 degrees.  

Figure 2. Maps of (left) July average temperature and (right) July average temperature departures from normal.

Overall, the preliminary statewide average July temperature was 75.3 degrees, 0.1 degrees below the 1991–2020 average and tied for 64th warmest on record going back to 1895.

Extreme Heat in Late July

July is the climatologically warmest month of the year in Illinois and typically has the highest frequency of extremely warm weather. The heat in Illinois in the last few days of July, though, was unusual, even for our hottest month. Daily high temperatures on July 27 and 28 exceeded 90 degrees across the state and topped 100 degrees in parts of western Illinois (Figure 3). Combined with extremely high humidity, heat index values pushed well over 100 degrees and even exceeded 110 to 115 degrees in some parts of central Illinois. Champaign reached a heat index of 115 degrees and Decatur had an incredibly dangerous 120-degree heat index on the afternoon of July 27. The latter number is only the third day on record with a 120+ degree heat index in Decatur and the first day since 1999.

Figure 3. Maps of (left) daytime high temperatures and (right) nighttime low temperatures across Illinois between 7 am on July 27 and 7 am on July 28. Maps provided by the Lincoln National Weather Service Office: https://www.weather.gov/ilx/illinois-daily.

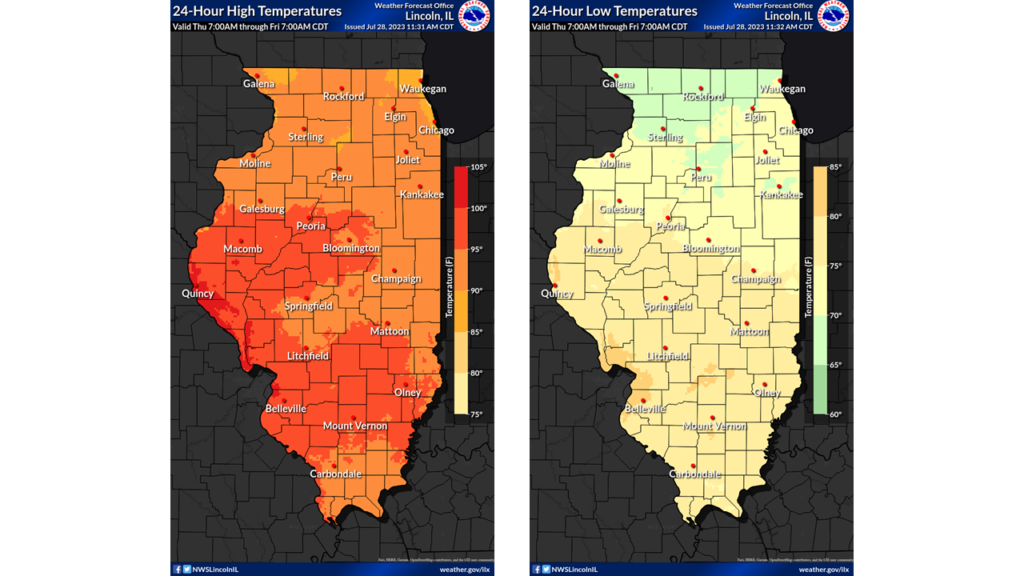
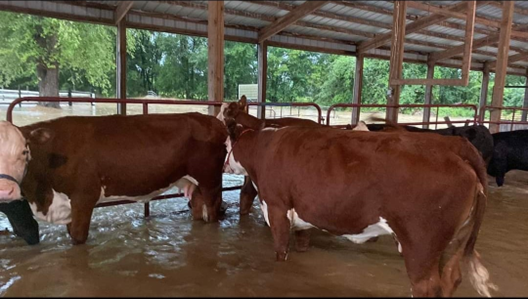
The maps in Figure 3 show that low temperatures overnight on July 27–28 only dipped into the mid-70s across much of the state, and a few places had nighttime lows at or above 80 degrees. The combination of very high temperatures–day and night–and relentless humidity presented extremely dangerous weather for humans and animals. Heat remains the deadliest weather hazard in the United States, but still doesn’t get as much attention as more visibly noteworthy hazards such as tornadoes and winter storms. Imagine if there were a community of “heat-chasers” who were equally passionate about documenting and warning of the impact of heat as storm chasers are for their hazards. Outside of health impacts, the heat buckled roads in central Illinois, forced the cancellation of many outdoor events and practices, and even forced a famed root beer stand in Peoria–one frequented by a certain State Climatologist–to temporarily shut down to protect workers. The heat also came at a busy time for farm workers, who remain one of the most vulnerable groups to heat-related health impacts in Illinois. 

Climate change has increased the frequency and intensity of hazardous heat conditions in Illinois, as in much of the United States. Figure 4 shows summer average maximum and minimum temperatures in Cook County between 1895 and 2022, with black lines showing 30-year trends over the long-term record. The plots show nighttime minimum temperatures have been consistently warming over the 125+-year record in Cook County, and daytime maximum temperatures have been increasing consistently since the early 1950s. Both daytime and nighttime temperatures are important for human and environmental health impacts from heat. Recent increases and projected continued increases in both summer maximum and minimum temperatures increase exposure risk to extreme heat across Illinois.

Figure 4. Plots show (left) summer average maximum temperatures and (right) summer average minimum temperatures in Cook County. The solid black lines represent 30-year trends over the long-term record.

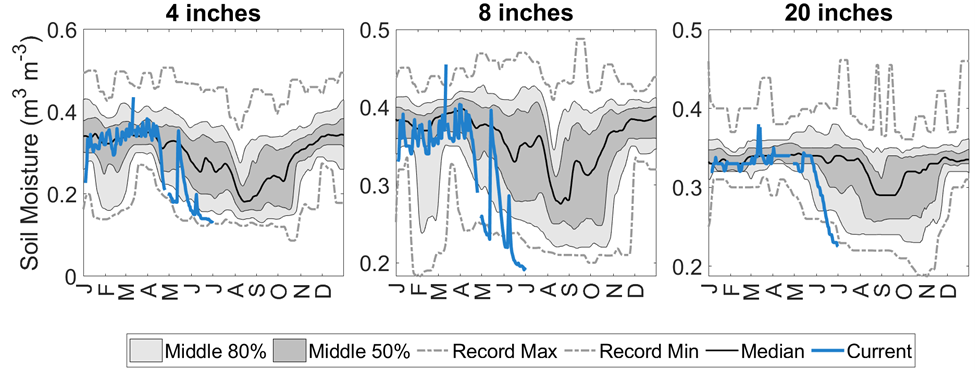
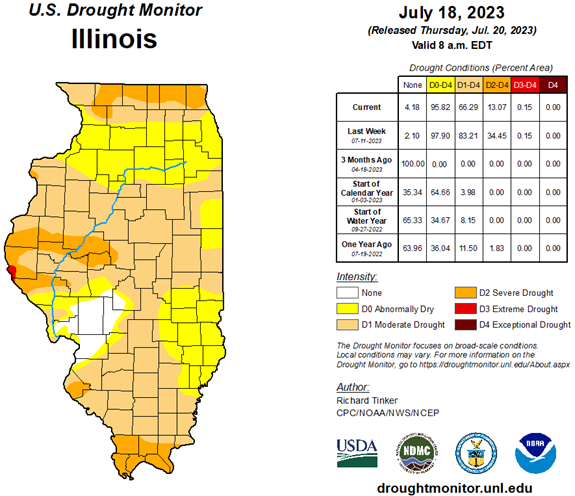
Some Drought Improvement with July Rainfall

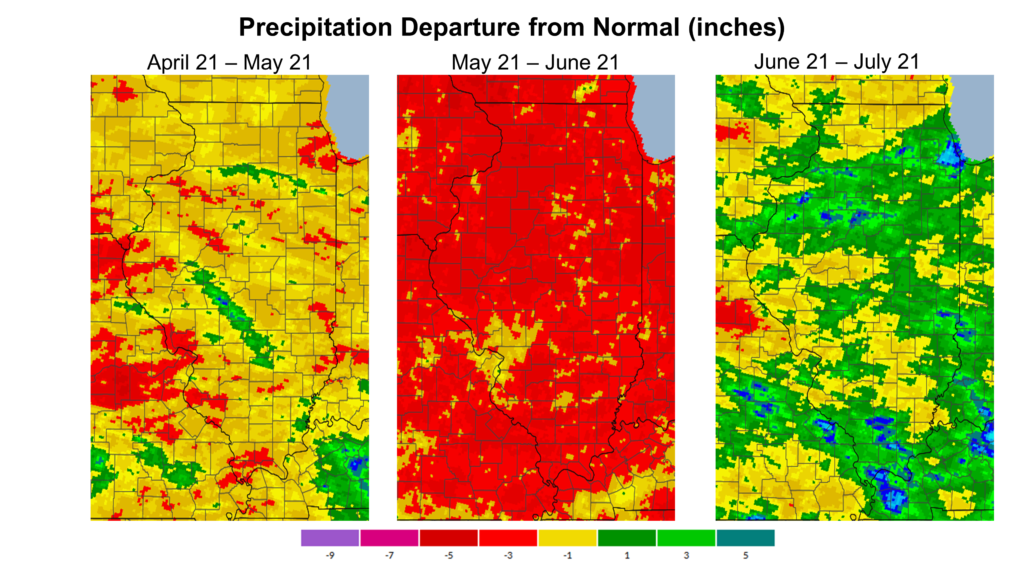
The period from April to June this year was the sixth driest on record statewide, and a top five driest on record in a handful of counties in Illinois. Moderate to extreme drought covered most of the state coming into July, and there were serious concerns of agricultural and hydrology impacts from the drought. July weather was somewhat to much wetter than the previous three months because of an active storm track coming over the ever-persistent ridge in the southwest U.S. 

July precipitation ranged from around 2 inches in western Illinois to over 10 inches in parts of southern Illinois. The southern and northeastern parts of the state were 2 to 6 inches wetter than normal last month because of very heavy precipitation events that are detailed below. Meanwhile, much of central Illinois was within 1 inch of normal and western Illinois was somewhat drier than normal (Figure 5). Last month was the wettest July on record at Chicago’s Midway airport, following what was the fourth driest April to June on record there.

Figure 5. Maps of (left) July total precipitation and (right) July precipitation departures from normal.

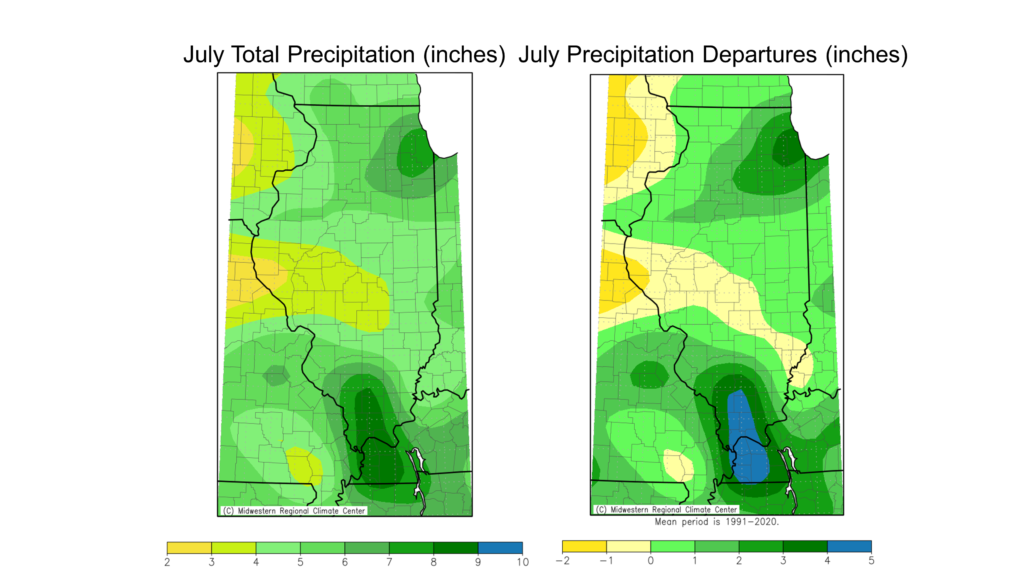
The preliminary statewide total July precipitation 5.08 inches, 1.02 inches above the 1991–2020 average and the 22nd wettest on record.

Heavy Rain in Chicagoland & Southern Illinois

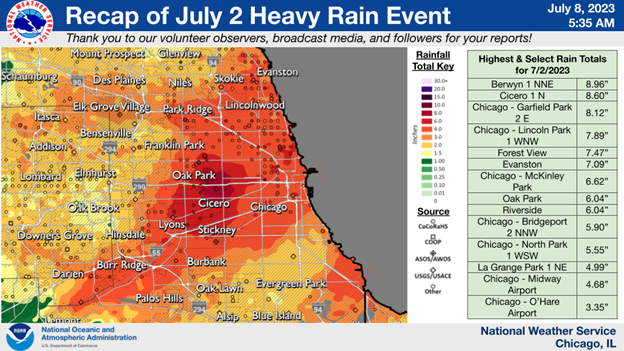
Meteorologists often quip that drought rarely breaks easily, referring to the alleged tendency for a drought to precede very heavy rainfall. The prolonged dryness in May and June in the Chicagoland area was indeed broken by a very intense rainfall event from a series of thunderstorms on July 1 and 2 (Figure 6). Among the highest 24-hour rainfall totals included 8.12 inches in Garfield Park, 8.6 inches in Cicero, and 8.96 inches in Berwyn. Based on the State Water Survey’s Bulletin 75 estimates, the event exceeded the estimated 1% annual exceedance probability storm (i.e., the 100-year storm*) in a few places. The heavy rain inundated stormwater systems and caused widespread flooding across the city, with thousands reporting flooded basements in Chicago alone.

*Two important caveats: 1) the “100-year storm” has a 1% chance of happening any given year, not once every 100 years, and 2) research has shown storm totals are increasing across Illinois, with a significant contribution from climate change.

Figure 6. Map of estimated and measured 24-hour rainfall totals across Chicagoland (source: Chicago National Weather Service: https://www.weather.gov/lot/2023_07_02_Flooding).

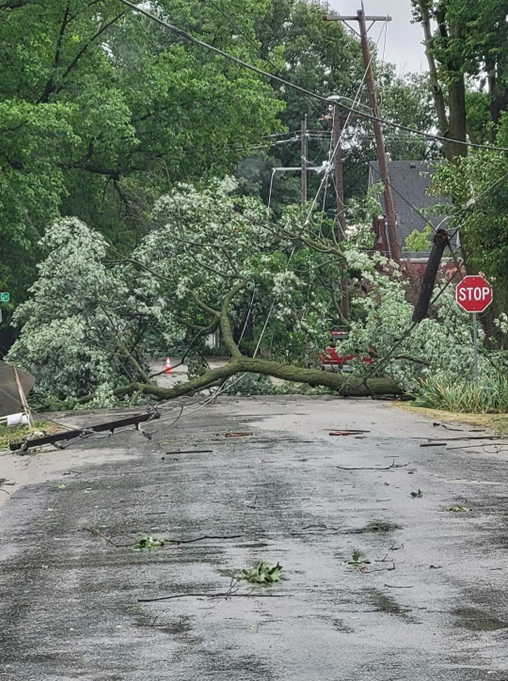
Never to be outdone, southern Illinois decided to get in on the heavy rain action and experienced an incredibly intense series of training storms on July 18 and 19. Parts of Williamson, Johnson, Pope, Alexander, and Pulaski counties picked up over 8 inches of rain in less than 24 hours, with rainfall rates exceeding 3 inches per hour. Flash flooding occurred across the region, including at the Massac County Youth Fair (Figure 7). The event brought even more rain to western Kentucky and may have broken the Kentucky state record 24-hour rainfall total, with a preliminary 12.76 inches measured in Graves County. The measurement will need to be validated by a records committee before becoming official.

Figure 7. Not so happy cows at the Massac County Youth Fair after the area picked up 5–6 inches of rain in less than 24 hours.

July Gave Out Free Smoke

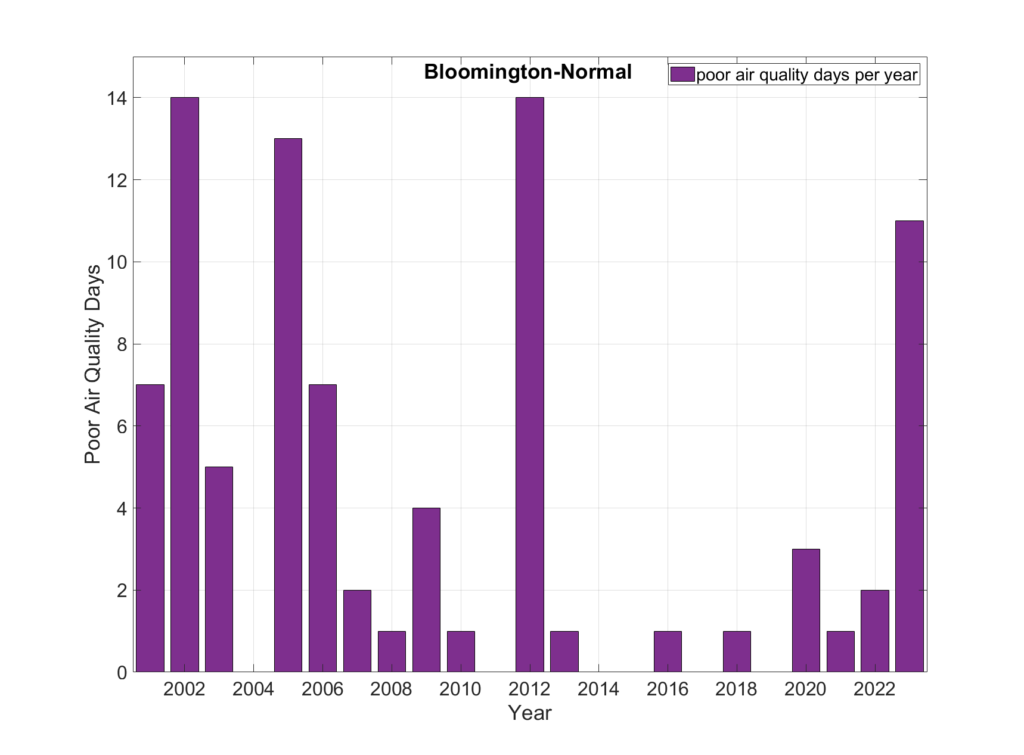
As wildfires continued to burn across Canada in July, the Midwest ephemerally suffered from poor air quality as a result. While not quite as intense as in late June, much of northern and central Illinois experienced multiple days of unhealthy air quality last month. Figure 8 shows the number of poor air quality days (EPA Air Quality Index > 100) in Bloomington-Normal each year through July 31. Past drought years like 2012 and 2005 stick out with relatively frequent poor air quality days. However, the primary pollutant in these years was surface ozone, which is created effectively at very high temperatures that often correspond with drought. This year our high surface ozone levels have been augmented by high particulate matter from Canadian wildfire smoke.

As with extreme heat, health impacts from poor air quality are felt largely by folks most vulnerable to environmental hazards, including those experiencing homelessness or housing insecurity, those with strenuous outdoor jobs, and those with chronic respiratory and pulmonary illnesses such as asthma and COPD. The complicated territory and sheer size of the fires in Canada hinder their management, so it is likely the Midwest will continue experiencing on-again off-again poor air quality days in the coming weeks as long as the fires keep burning. 

Figure 8. Number of poor air quality days (AQI > 100) in Bloomington-Normal through July 31 from 2001 to 2023. AQI information is available here: https://www.airnow.gov/.

Late June Derecho

The switch from a dry June to wet and active July happened on June 29. That day, several rounds of severe storms moved through central and southern Illinois, producing large hail and a few tornadoes. The most destructive impacts from the storm, though, came from the derecho it produced: https://www.weather.gov/ilx/june29_derecho. A derecho is a widespread, long-lived windstorm that is associated with a series of strong thunderstorms. Most derecho impacts come from its incredibly strong straight-line winds. The June 29 event produced widespread 70–80 mph wind gusts from the Quad Cities to Danville, including one personal weather station in Taylorville that measured 101 mph wind.

The derecho caused substantial damage to trees, homes, and buildings, and caused widespread power outages. Perhaps some of the worst storm damage was in Springfield, which had an estimated $20 million in damages alone (Figure 9). The derecho caused significant crop damage across central Illinois, although not nearly to the extent of the infamous 2020 derecho that moved across Iowa, Illinois, and Indiana. This year’s derecho happened earlier in the growing season when corn was shorter and less brittle, and thankfully, it was much weaker than the 2020 event.

Figure 9. Photo of tree damage in Blue Mound, Illinois. Source: Chloe Moyer.

Speaking of Severe Weather…

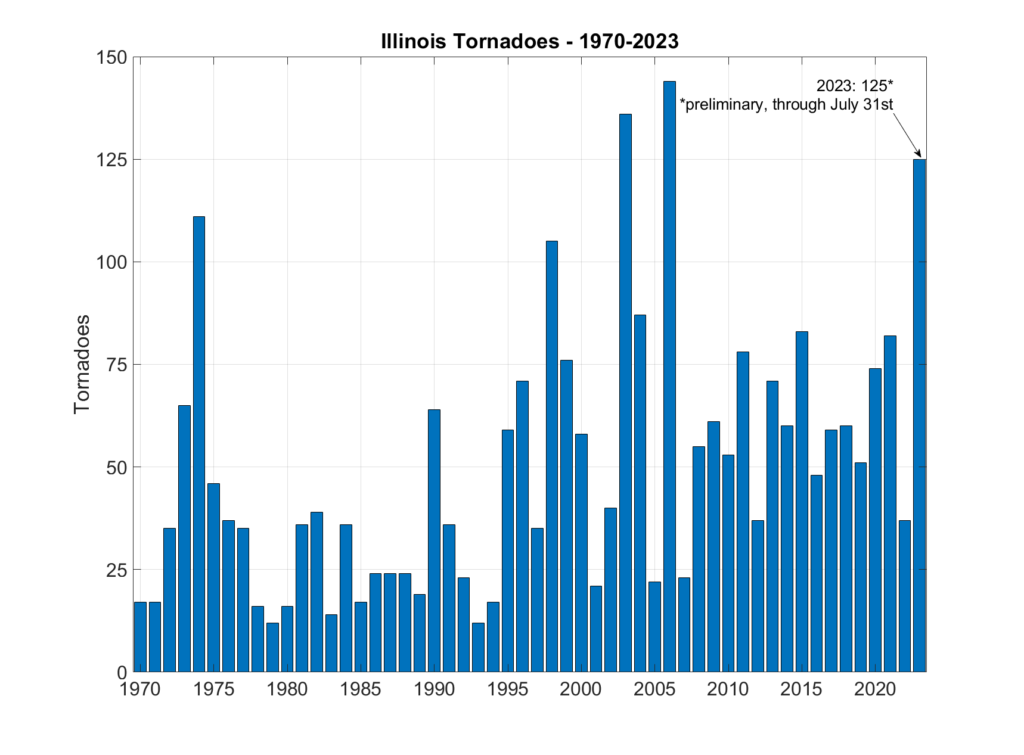
No matter if we’re in Cairo, Egypt or Cairo, Illinois, drought is caused by a lack of precipitation over a period sufficiently long as to cause impacts. Because the same storms that bring severe weather also account for a big chunk of our warm season precipitation, summer drought years also tend to have a dearth of tornadoes, hail, and storm winds, but not this year. As of July 31, Illinois has had 125 tornadoes in 2023 reported by the Storm Prediction Center. Importantly, this is a preliminary total and may be adjusted later this year as reports are refined. However, if that total is accurate, it would give this year the third highest tornado frequency on record for any year (Figure 10). The current annual tornado record for Illinois is 142 in 2006.

Figure 10. Annual number of tornadoes in Illinois from 1970 to 2023. The 2023 total is preliminary and through July 31.

Outlooks

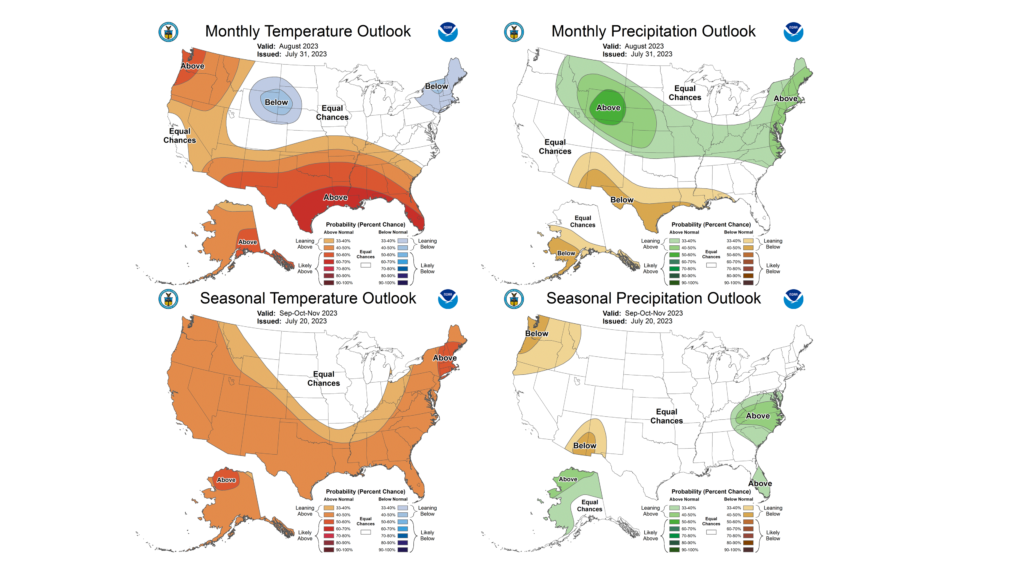
August is the beginning of the end of summer but can certainly bring its fair share of heat. August is also an important month for finishing crops as we move toward fall. The most recent Climate Prediction Center outlooks for August show equal chances of above and below normal temperatures in much of the state, with higher odds of above normal temperatures in the southeast U.S. (Figure 11). Precipitation outlooks are leaning wetter than normal for much of the state, which would help continue the march out of drought in Illinois.

The bottom row in Figure 11 shows temperature and precipitation outlooks for the climatological fall season, September–November. The outlooks are decidedly equivocal, with equal chances of warmer, cooler, wetter, and drier than normal conditions in fall. It’s important to note that August to October is the “heart” of tropical storm season in the Atlantic, but the monthly and seasonal outlooks for the Midwest do not include any prediction of tropical storm frequency.

Figure 11. Maps of (left) temperature and (right) precipitation outlooks. The top row shows outlooks for August and the bottom row for September–November.

Illinois Falls into Drought

Following a fairly wet start to 2023, most of Illinois has experienced well below normal precipitation between April and June. In this summary, we review the evolution of the 2023 drought between the beginning of April and middle of July and discuss the drought’s implications to Illinois so far.

Dry April, No Worries

The first half of April was 1 to 2 inches drier than normal and included a full seven days without any precipitation in the entire state of Illinois. The very unusual dryness in early April came after wetter than normal months of January, February, and March, and was well timed for spring fieldwork that depends on workable soils. The dryness persisted through the second half of April, as much of Illinois was 1 to 2 inches drier than normal. April ended 1 to 3 inches drier than normal across the state, with the largest departures in central Illinois. Champaign, for example, experienced its 18th driest April on record with 1.68 inches total, more than 2 inches below normal.

Figure 1. Maps show (left) precipitation total and (right) precipitation departure from normal in April.

April was slightly warmer than normal in Illinois, but not extremely so. However, we frequently experienced unusually dry air across the state in a time when humidity is often prevalent. One of the best measures of the dryness of air is the vapor pressure deficit, with higher values indicating overall drier air. Springfield’s average vapor pressure deficit in April was much higher than average and the highest since 2012 (Figure 2). The dry air in April helped augment the lack of precipitation and resulted in very dry topsoil conditions across central Illinois going into May. It is likely the lack of April precipitation and dry air were two important components that contributed to the May 1 dust storm in central Illinois.

Figure 2. Plot shows April average vapor pressure deficit in Springfield between 1948 and present. The green bars show below average vapor pressure deficit and the pink bars show above average vapor pressure deficit.

May Continues the Dryness – Drought Emerges

The first half of May brought uneven precipitation to Illinois, though precipitation, nonetheless. Most areas in the state picked up between 1 and 3 inches in the first half of May, while an isolated area from Sangamon to Clark counties in central Illinois caught between 4 and 8 inches, most of which fell in less than 24 hours. Outside of the inundated parts of the state, the drier start to May helped move planting along and–combined with near to slightly cooler weather–made for a very enjoyable few weeks in the Midwest. However, dryness really set in the last two weeks of May, as many parts of the state had virtually no rain between May 16 and May 31. The sheer lack of rainfall increased concerns of rapid onset drought in late May, as streamflow and soil moisture began to decrease quickly.

Overall, May ended about 2 inches drier than normal statewide, but extremely dry in some parts of the state. Chicago had its fourth driest May on record, with only 0.71 inches in what is typically a top-three wettest month in the windy city. The US Drought Monitor introduced moderate drought in northeast and central Illinois in late May in response to the persistently dry conditions.

Figure 3. Maps show (left) precipitation total and (right) precipitation departure from normal in May.

From Awareness to Concern – Drought Intensifies in June

Climatologically, June is the wettest month of the year in Illinois. However, this year June followed the dry pattern of April and May and has brought much below normal rainfall across the state. In fact, the state recorded an average of just 1.13 inches of rainfall in the first 28 days of June, the third lowest on record and wetter only than 1988 and 1959. Soils were extremely dry across the state in late June. The 8-inch soil moisture at the Illinois Climate Network station in Champaign was at its lowest (driest) point on record on June 28, with a daily record back to 2004 (Figure 4).

Figure 4. Plots show soil moisture (blue line) at 4, 8, and 20 inch depths at the Illinois Climate Network site in Champaign as of June 28, 2023. The blue lines are overlayed on the background climatology of soil moisture conditions across the calendar year. The thick, black lines show the 19 year average soil moisture condition for each day of the year, and the dashed gray lines show the record wettest and record driest conditions for each day of the year.

The very dry start to June pushed stream and pond levels much lower than normal as water tables dropped across the state. While conditions did not progress to affect rural wells or municipal water supply, many producers’ stock ponds dropped to unsuitably low levels, creating issues with water supply and water quality for cattle and other livestock (Figure 5). Producers were also challenged by increasingly poor pasture conditions from the drought, forcing many to supplement with hay, at a very high economic and labor cost.

Figure 5. Photo of a depleted stock pond in Champaign County, Illinois. Photo source: Trent Ford, June 25

A Little Drought Relief in July

Rain in the last few days of June and first week of July have helped stop deteriorating drought conditions and have improved crop and stream conditions somewhat. As is typically the case with drought recovery in July, precipitation was spotty and inconsistent. The areas that have caught more than 2-3 inches of rain since the start of July have seen dramatic improvement in soil, crop, and stream conditions. However, some parts of the state have continued to largely miss beneficial rains, creating a patchwork of haves and have nots. Moving forward, we will need consistent, near to above normal precipitation through August to really begin to improve drought conditions and avoid worse impacts to agriculture, ecology, and hydrology.

The maps in Figure 6 show precipitation departures in each month from April 21 to July 21, and the cumulative precipitation departures over that time across the state.

Figure 6. Maps show precipitation departure from normal from (left) April 21 to May 21, (middle) May 21 to June 21, and (right) June 21 to July 21.

The latest US Drought Monitor map (Figure 7) shows some improvement across the state, relative to the heart of the drought in late June. With that said, over two-thirds of the state remains in at least moderate drought, and 13 percent of Illinois is in severe drought.


Figure 7. Map shows the US Drought Monitor condition in Illinois, current as of July 18.

Drought Worsens in a Very Dry June

The statewide average June temperature was 71.6 degrees, 0.6 degrees below the 1991–2020 average and the 52nd warmest on record going back to 1895. The statewide total June precipitation was 1.81 inches, 2.84 inches below normal and the 9th driest June on record statewide.

Pleasant June Temperatures

June began summer-like, with daily high temperatures in the high 80s to low 90s statewide. As the temperature departures from Champaign in Figure 1 show, a cool front toward the end of the first week of the month dropped temperatures considerably, and most of the second and third weeks of June had below normal temperatures in Illinois. The heat came back in the last 10 days of the month but was not extremely high until the last couple days of June.

Figure 1. Daily May average temperature departures in Champaign.

June average temperatures ranged from the high 60s in northern Illinois to the high 70s in southern Illinois, between 1 and 3 degrees above normal in northwest and parts of central Illinois, and between 1 and 4 degrees below normal in eastern and most of southern Illinois (Table 1a, Figure 1). The dry air in the Midwest for most of the month kept daytime temperatures high but allowed nighttime temperatures to regularly dip into the 50s. In fact, while daytime high temperatures in June were 1 to 4 degrees above normal, nighttime low temperatures were 1 to 4 degrees below normal, making for one of the most comfortable Junes in recent memory. The warmest place in the state last month was Olmstead in Pulaski County with an average temperature of 75.9 degrees, and the coolest place in the state in June was Waukegan with an average temperature of 65.5 degrees.

Altogether, 20 daily high maximum temperature records and 3 daily high minimum temperature records were broken in June. In addition, 13 daily low maximum temperature records and 24 daily low minimum temperature records were broken last month.

Figure 2. Maps of (left) June average temperature and (right) June temperature departures from normal.

Many stations had daytime high temperatures in the upper 90s, and a few places hit or exceeded 100 degrees in the last few days of June. These included 101 degrees in Randolph County and 100 degrees in Perry County. Carbondale hit 100 degrees for the first time since 2012, reaching the mark on June 25. Meanwhile, many places saw nighttime lows dip into the mid- to low 40s in mid-June, including 40 degrees in McHenry County and 42 degrees in Woodford County. The warmest place in the state last month was Olmstead in Pulaski County with an average temperature of 75.9 degrees, and the coolest place in the state in June was Waukegan with an average temperature of 65.5 degrees.

Overall, the statewide average June temperature was 71.6 degrees, 0.6 degrees below the 1991–2020 average and the 52nd warmest on record going back to 1895

Very Dry June Adds to Deficits

June is typically a wet month in Illinois, but this year June followed the dry pattern of April and May. Last month was the driest June since 2012. June precipitation ranged from less than 1 inch in far western and southwest Illinois to isolated spots of over 7 inches in northwest and southeast Illinois. Most places in the state had between 2 and 5 inches below normal rainfall in June (Figure 3). Last month capped off an extremely dry start to the growing season, going back to April 1st. The period between April 1st and June 30th was the 2nd driest on record in Quincy, the 3rd driest in Moline, the 5th driest in Champaign, the 8th driest in Peoria, and the 11th driest on record in Chicago. Quincy, for example, had 4.53 inches of rain in April, May, and June together, which was 0.80 inches less than that period in 2012 and 1.48 inches less than in 1988.

The statewide total June precipitation was 1.81 inches, 2.84 inches below normal and the 9th driest June on record statewide.

Drought in Illinois

The dry weather from April through June has put Illinois in its most serious drought since 2012. Soils throughout the state are very to extremely dry down to 12 inches and in some places down to 20 inches. The 8-inch soil moisture at the Illinois Climate Network station in Champaign was at its lowest (driest) point on record as of June 28, with a record going back to 2004. Streams and ponds are much lower than normal across the state, but conditions have not progressed to affect rural wells or municipal water supply.

Agricultural impacts have multiplied in the past few weeks, including visible stunting and stress in corn and beans, especially late-planted beans. Producers have reported spider mite damage, which is a common problem in drought years. It is not clear if the drought has yet caused widespread, significant yield loss in corn or beans. The critical growth stages of both crops tend to occur in the last few weeks of July and first week of August, so there may still be an opportunity for a decent crop if the state can get more consistent rain throughout July. Pasture conditions remain poor in many areas, with little regrowth since the first cutting of hay, which increases concerns of hay supplies later this year. Mature trees in central and northern Illinois are showing significant stress from the prolonged dry conditions, including dropping leaves. Lawns in many places have been dormant since Memorial Day.

The most recent U.S. Drought Monitor map shows over 90 percent of the state in at least moderate drought and over half of the state now in severe drought. Extreme drought (D3) has sneaked across the Mississippi River into a sliver of Adams and Hancock counties in western Illinois (Figure 4).

Figure 4. The U.S. Drought Monitor map current as of June 27.

The recent rain will at least stall worsening drought conditions and may help to improve conditions in some places. However, we will need at least another three to four weeks of consistent rain of 1 to 1.5 inches per week to improve drought conditions in earnest. As conditions evolve, for better or worse, please continue to report conditions and impacts with the National Drought Mitigation Center’s CMOR system: go.illinois.edu/cmor.

Air Quality Issues

Wildfires have been burning in parts of central and eastern Canada most of this summer. The location of the ridge and corresponding high-pressure center in the Great Lakes region created unusual northeasterly wind, meaning the wind blew from northeast to southwest in late June. As a result, wildfire smoke moved into parts of the Midwest and caused extremely poor air quality, mostly from particulate matter. Figure 5 shows a snapshot of the EPA’s air quality index (AQI) from June 28 over Illinois. The AQI ranges from 0 (very good air quality) to 500+ (hazardous air), and much of northern and central Illinois spent 24–48 hours in the “unhealthy” or “very unhealthy” categories, representing some of the worst air quality the state has experienced in many years. A weather pattern shift on June 29 helped move the wildfire smoke farther to the east and improved air quality in Illinois; however, air quality issues will continue to be a periodic problem as long as the Canadian wildfires continue to burn.

Figure 5. Snapshot of the EPA’s air quality index over Illinois on June 28.

Outlooks

July is the climatological hottest month of the year in Illinois and can make or break a growing season with its rain (or lack thereof). The first week of July is looking wetter than normal, with widespread forecasted totals exceeding 1 inch across the state. The latest 8- to 14-day outlooks from the Climate Prediction Center lean toward wetter than normal, hopefully continuing that wetter trend (Figure 6). Although the drought in Illinois will take many weeks to break, wetter conditions in July can help limit drought impacts as we move into late summer.

Figure 6. Maps show (left) temperature and (right) precipitation outlooks for the second week of July.

Drought Worsens in Illinois

Dry conditions have persisted through May and into the first two weeks of June. While some parts of Illinois have received beneficial rain in the past week, totals have mainly been less than 1 inch, not enough to improve conditions. The maps in Figure 1 show most of Illinois has had less than 2 inches of rain over the past 30 days. The northern half of the state has largely seen less than 50 percent of normal rainfall since April 1st, and parts of the Chicagoland area have had less than 25 percent over that period. In fact, the period between April 1st and June 10th was the second driest on record statewide, wetter only than 1988.

Figure 1. (Top) maps show precipitation total and percent of normal over the past 30 days. (Bottom) plot shows total precipitation across Illinois from April 1 to June 10, between 1951 and 2023.

A wetter winter and lack of extreme heat so far this summer have both helped limit drought impacts so far. Reports across the state indicate lawns are browning or going dormant, gardens, shrubs, and small trees require frequent watering, and mature trees are beginning to show stress. Streamflow in much of the state is well below normal and is near the record low at a few places on the Illinois River, including Henry and Valley City. Crop reports indicate corn and soybeans in parts of southwestern, central, and northeastern Illinois are showing some stress, including rolling corn leaves and slowed growth. However, the overall feeling is that yield potential has not been significantly affected at this point. Pasture conditions have declined to a larger extent than row crops, and there are some concerns about hay yield and quality moving forward.  

The US Drought Monitor on June 13th shows severe drought (D2) in northeastern and central Illinois, including most of the Chicagoland area and all of Peoria (Figure 2). Most of the state north of Interstate 70 is in abnormal drought, as is much of the St. Louis Metro east area, while southern Illinois remains abnormally dry.

https://droughtmonitor.unl.edu/data/png/20230613/20230613_il_trd.png
Figure 2. The U.S. Drought Monitor map current as of June 13.

Outlooks

The most recent 7-day precipitation forecast from the National Weather Service shows more rain for the southern half of the state, with widespread chances of 1 to 1.5 inches in the next week (Figure 3). However, less accumulation is forecast for central and northern Illinois, with totals mostly less than half an inch. While some rain is better than no rain, we will need more consistent wetter conditions soon to avoid worsening impacts. To be clear, if we continue in a somewhat to very dry pattern over the next three to four weeks, we will likely see more extensive and severe drought impacts.

Figure 3. Map of forecast 7-day precipitation totals, valid between June 15 and June 22.

Farther out, the outlooks for the latter half of June show the highest chances of near normal rainfall and above normal temperatures (Figure 4). Warmer weather could quicken impacts through higher evaporation, but even near normal precipitation in late June would help reduce impacts as we move into the heart of the growing season.

Figure 4. Maps show temperature and precipitation outlooks from the Climate Prediction Center for the last week of June.

What Can I do?

The message is the same as it was in the early stage of drought: water conservation and condition reports. Water conservation is extremely important to minimize the decline of stream and lake levels. Additionally, citizen reports of drought conditions and impacts greatly assist with the drought management effort. Reports can include how wet or dry it is around you, impacts to trees, gardens, pastures, crops, etc., and stream or pond levels around you.

Impact reports can be submitted through:

The National Drought Mitigation Center’s Condition Monitoring Observer Reporting (CMOR) system: go.illinois.edu/cmor.  

or via email to the Illinois State Climatologist Office: statecli@isws.illinois.edu.

Also, if you observe precipitation for CoCoRaHS, please consider submitting a weekly condition monitoring report: https://www.cocorahs.org/content.aspx?page=condition. Every report makes a difference and helps us understand drought conditions and can direct help and resources where they need to go in the state.  

Partners

National Weather Service Offices

            Chicago: https://www.weather.gov/lot/drought

            Quad Cities: https://www.weather.gov/dvn/drought

            Central IL: https://www.weather.gov/ilx/drought

            St. Louis: https://www.weather.gov/lsx/drought

            Southern IL: https://www.weather.gov/pah/drought

National Drought Mitigation Center: drought.unl.edu

National Integrated Drought Information System (NIDIS): drought.gov/drought/