September Brought a Mix of Summer & Fall

The preliminary statewide average September temperature was 68.1 degrees, 1.3 degrees below the 1991–2020 average and tied for the 38th warmest on record going back to 1895. The preliminary statewide total September precipitation was 2.64 inches, 0.71 inches below the 1991–2020 average and the 42nd driest on record.

Data are provisional and may change slightly over time.

Fall Start and Summer Finish

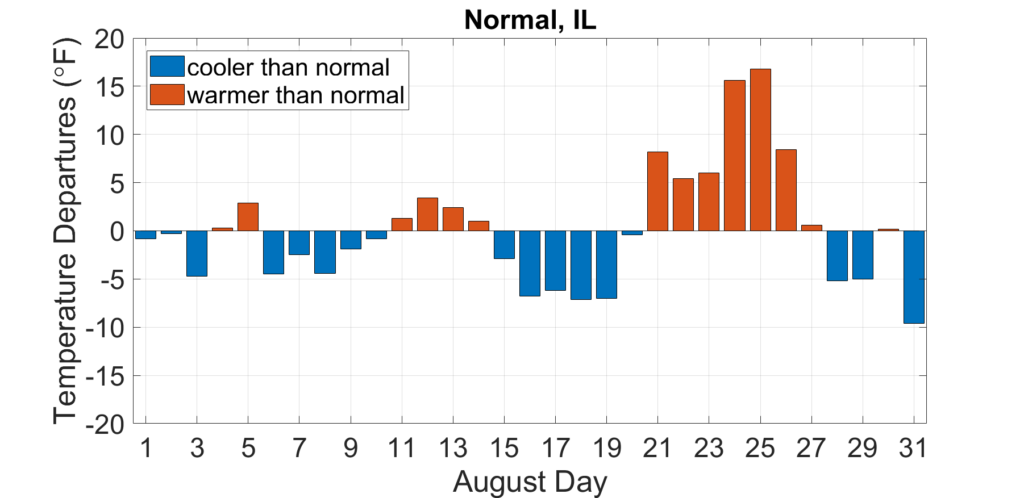
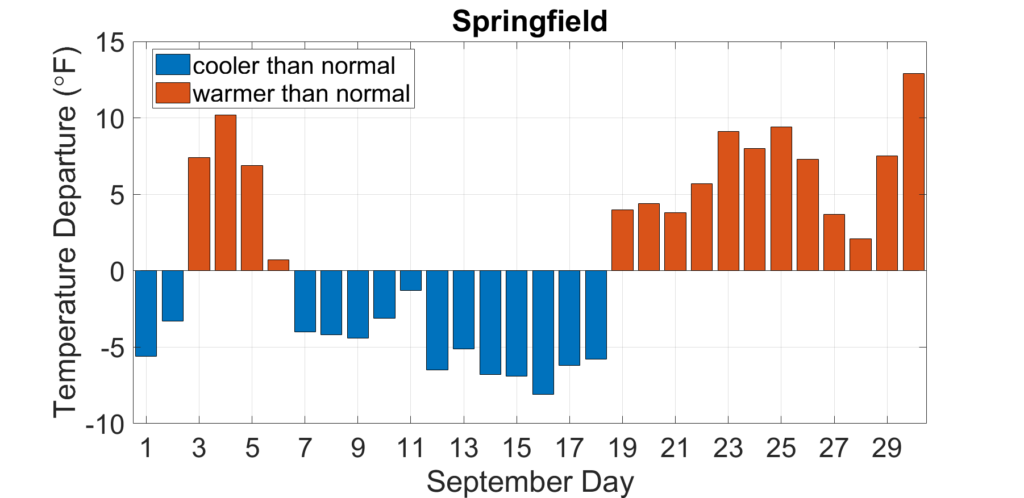
September is a transition month as we move from summer into fall. However, this year September started with fall-like weather and ended with a shot of summer. Daily average temperature departures in Springfield show most days in the first two-thirds of the month were cooler than normal, followed by several days in the last two weeks that were 5 to 10 degrees warmer than normal (Figure 1).

Figure 1. Daily September average temperature departures in Springfield.

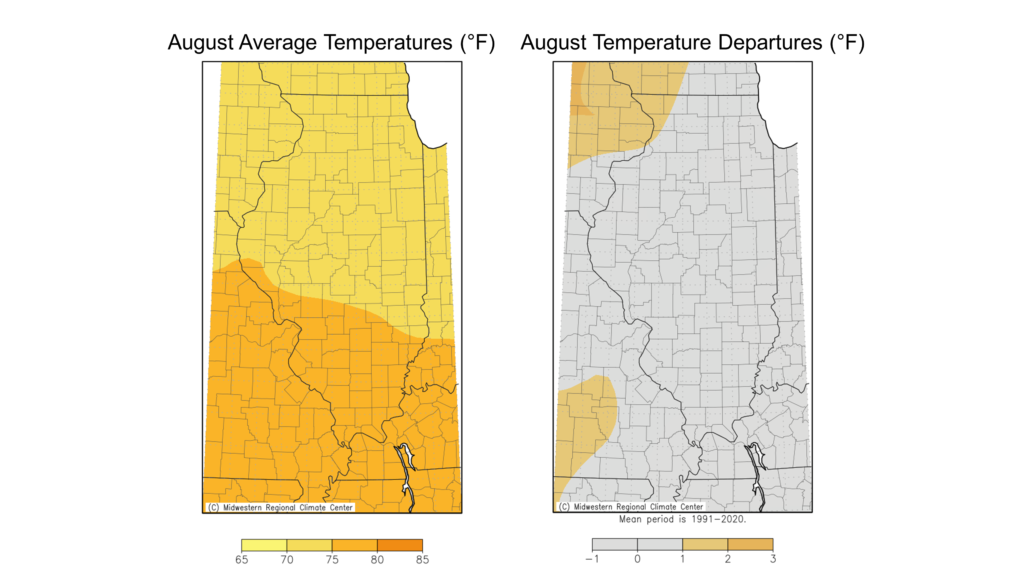
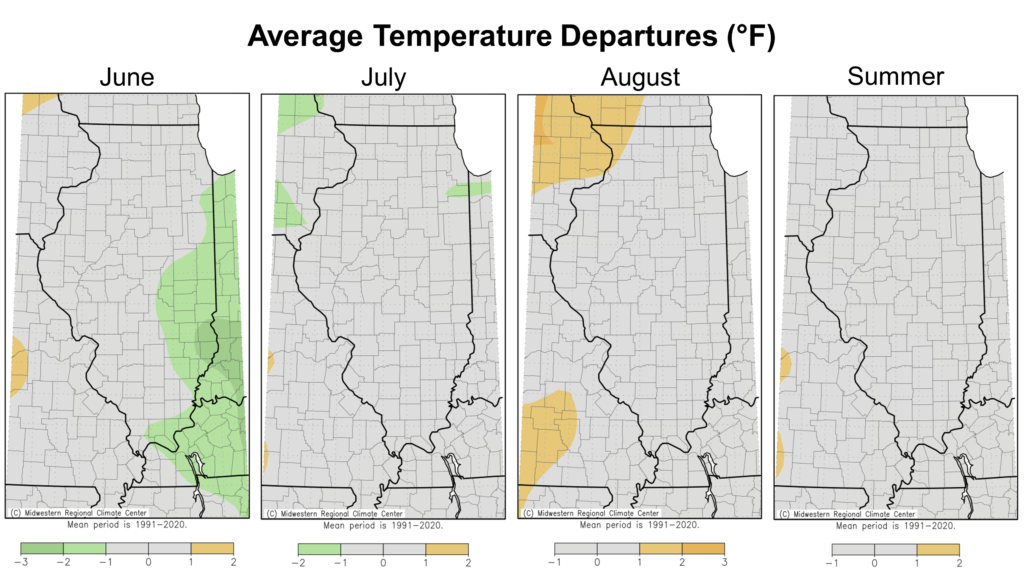
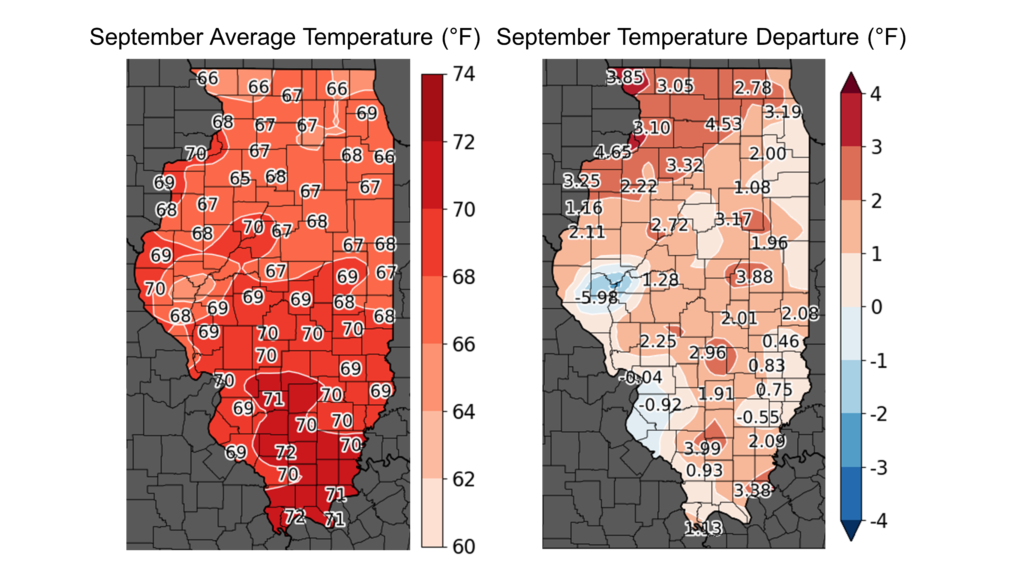
September average temperatures ranged from the mid-60s in northern Illinois to the low 70s in southern Illinois, between 1 and 4 degrees above normal (Figure 2). We should ignore the suspiciously low September average temperature near La Grange, Illinois because it is likely a measurement error. Several places hit highs in the low 90s in the latter half of September, including 94 degrees in Charleston and Aurora. Meanwhile, cooler weather in the first part of the month pushed some nighttime low temperatures into the 30s, including 37 degrees in Joliet and 39 degrees in Stockton.

The warm end to the month broke 10 daily high maximum temperature records and 10 daily high minimum temperature records. Additionally, 3 daily low maximum temperature records were broken last month.

Figure 2. Maps of (left) September average temperature and (right) September average temperature departures from normal.

Overall, the preliminary statewide average September temperature was 68.1 degrees, 1.3 degrees below the 1991–2020 average and tied for 38th warmest on record going back to 1895.

Dry Weather Kicks Off Harvest

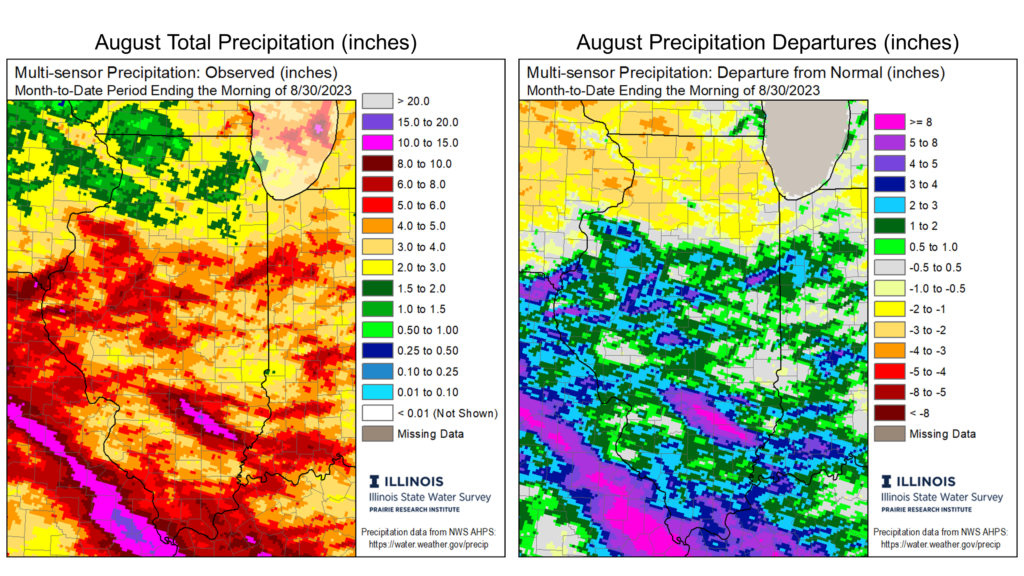
Another interesting aspect of September is that rain in the first half of the month is generally welcomed by the agriculture community to help finish out beans and late-planted corn. However, rain after mid-September usually disrupts, if not delays, early harvest activity. September this year worked in the opposite way, with drier conditions early and a bit more rain later in the month.

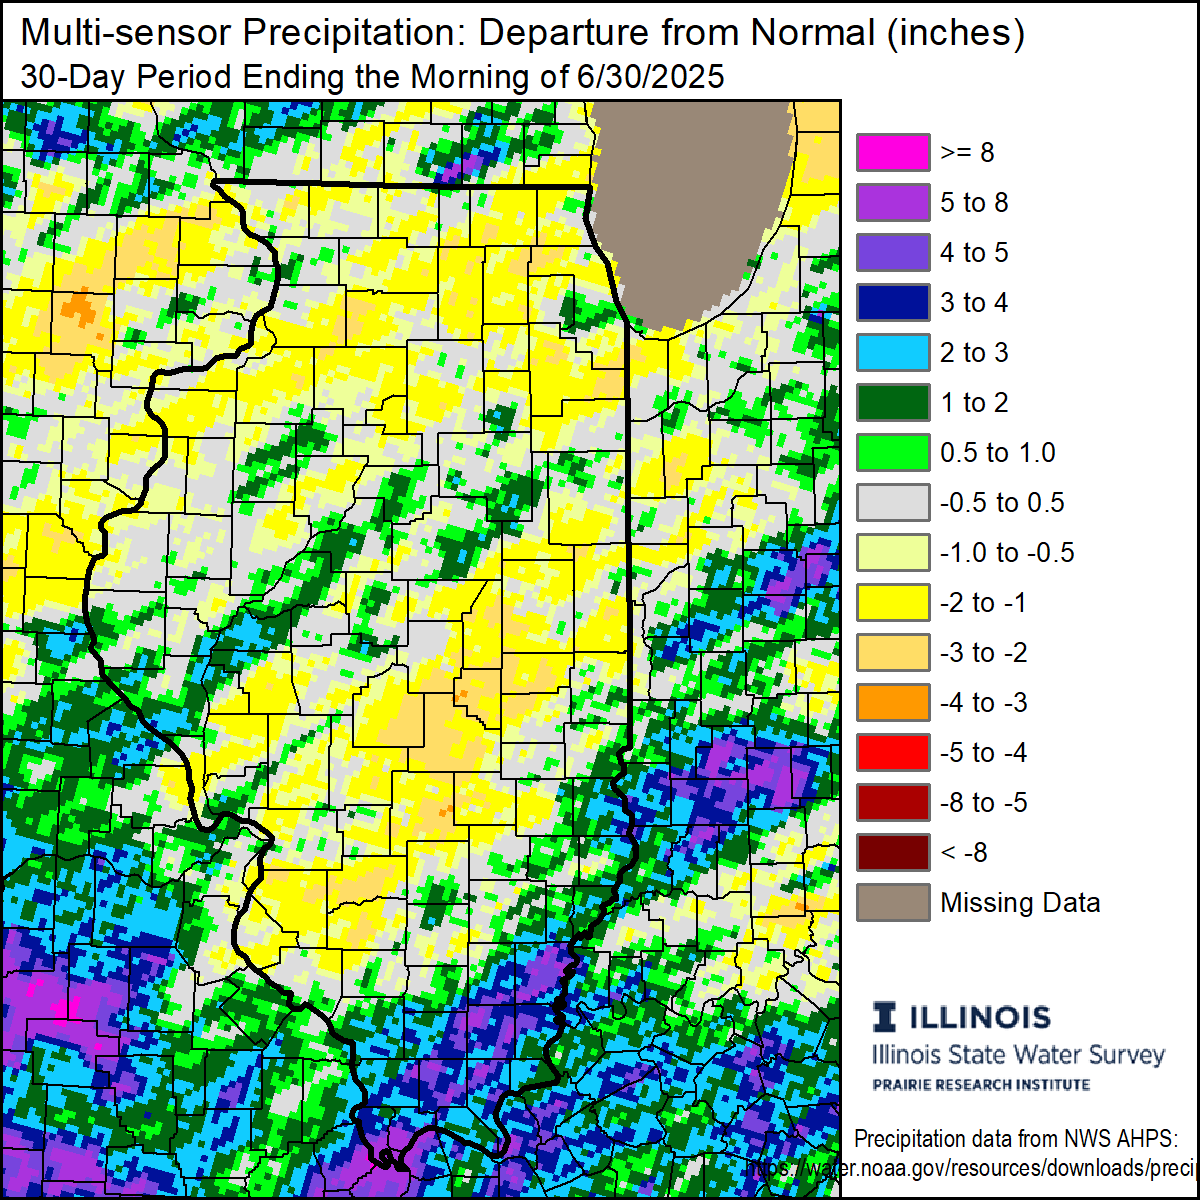
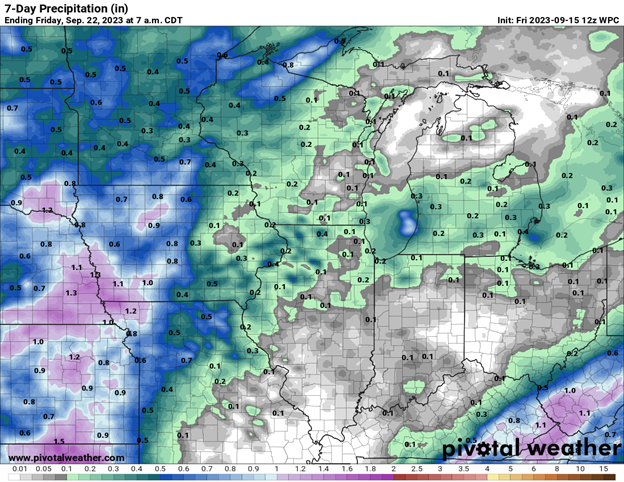
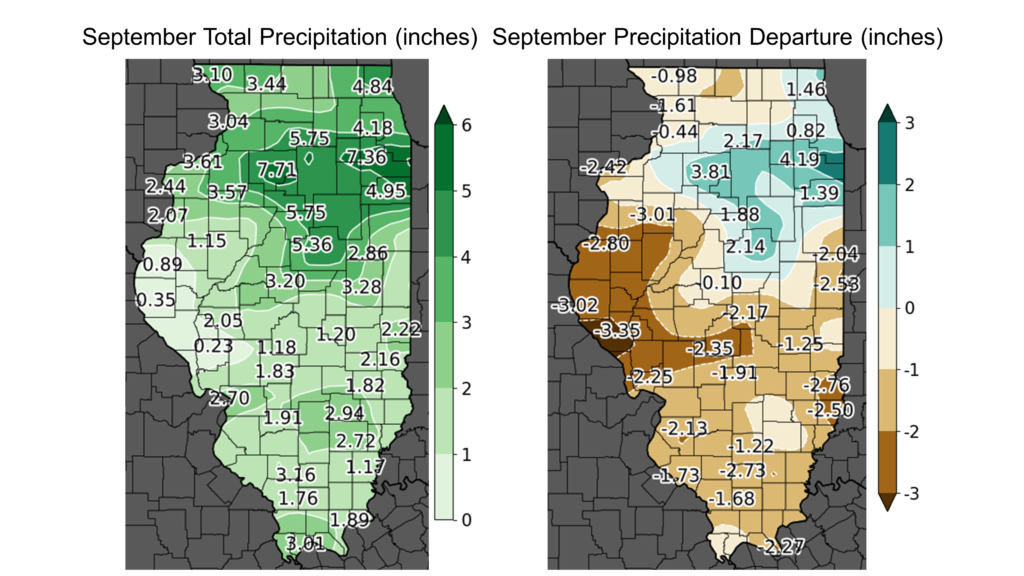
September precipitation ranged from less than half an inch in western Illinois to over 7 inches in northeast Illinois. The northeast quarter of the state was 1 to 4 inches wetter than normal in September, while much of the rest of the state was 1 to 3 inches drier than normal (Figure 3). Last month was the eighth wettest September on record in Joliet, with 6.76 inches. Last month was the fourth driest September on record in Quincy with just 0.35 inches.

Figure 3. Maps of (left) September total precipitation and (right) September precipitation departures from normal.

Broader Midwest Drought

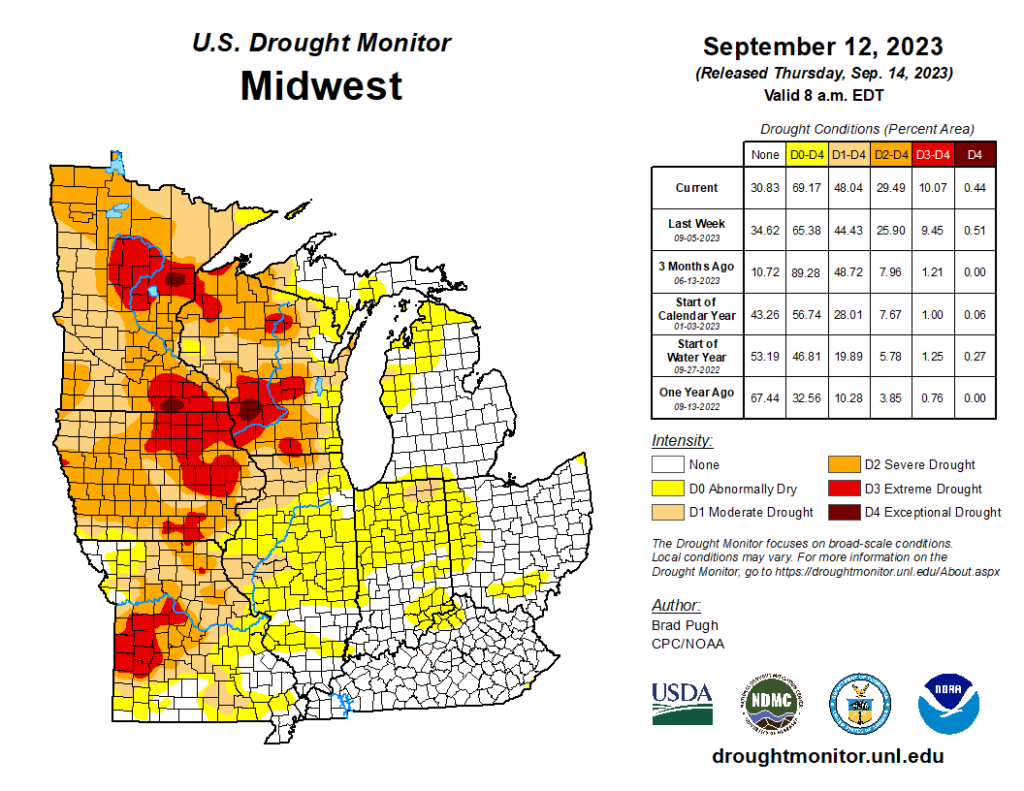
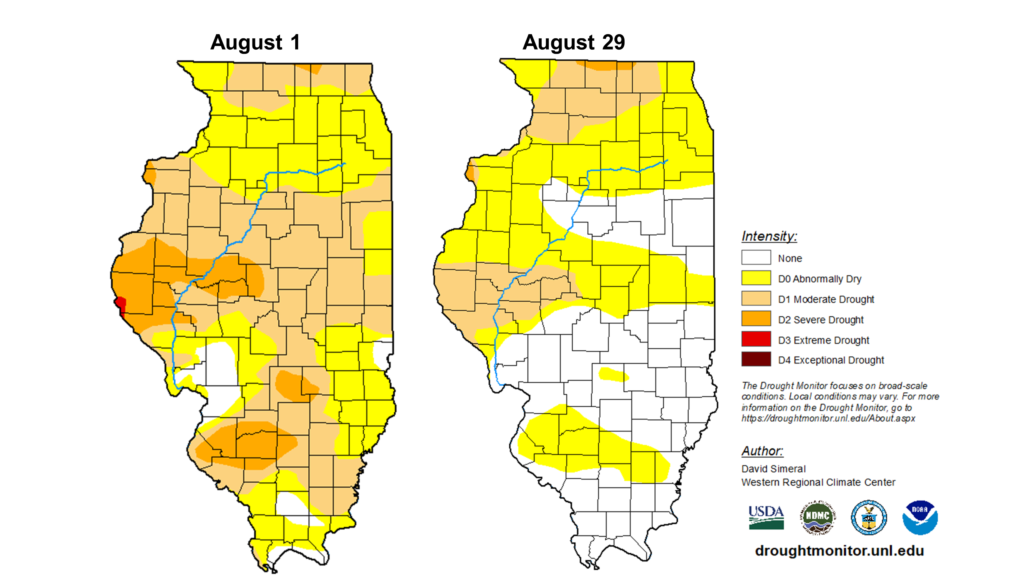
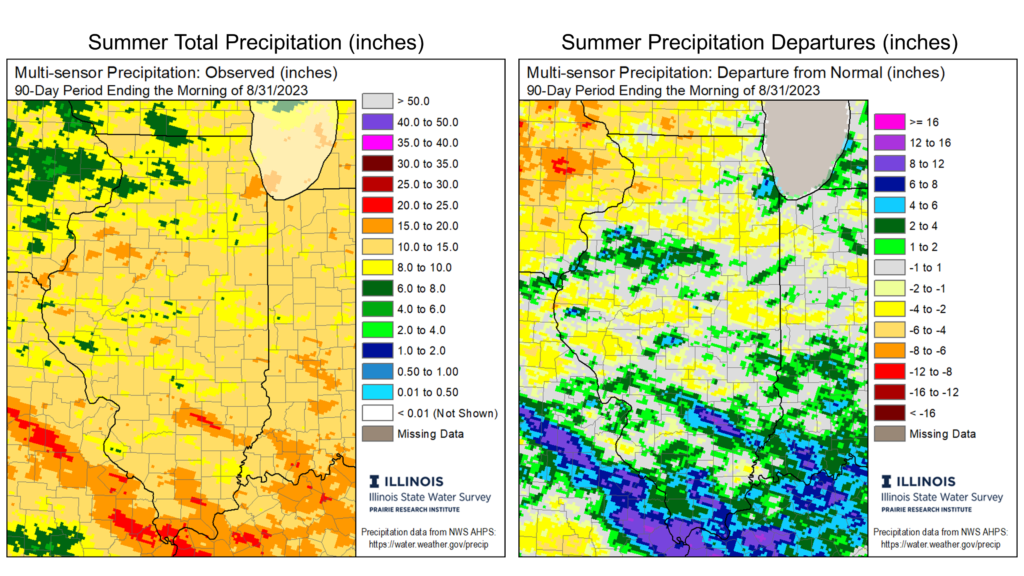
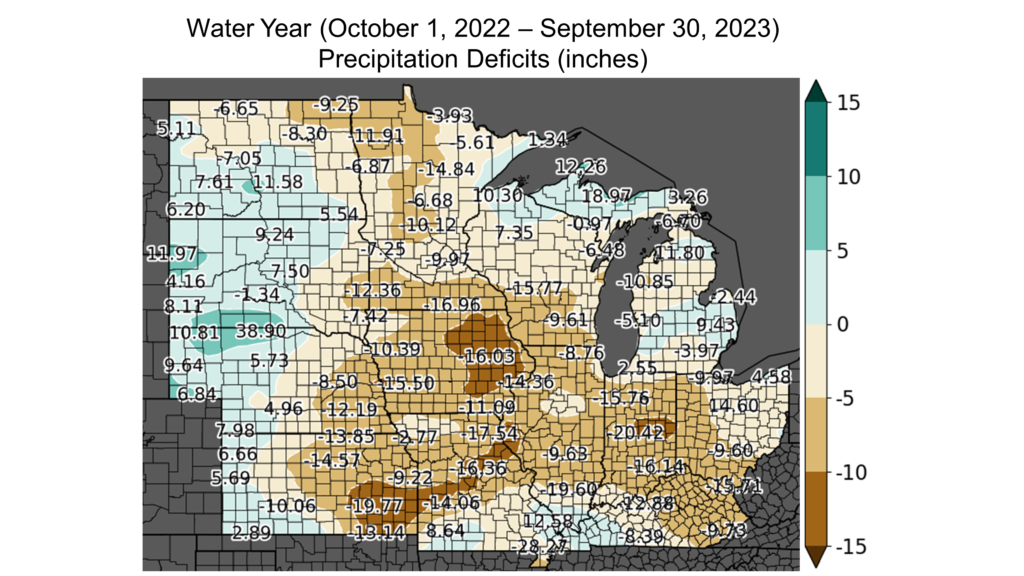
Drought is often considered an isolated event. A drought comes, it creates impacts, and it leaves. However, drought does not always go away with a wetter stretch of weather. In cases where multiple waves of drought are broken up by wetter periods, drought impacts can slowly accumulate. This phenomenon has been occurring in western Illinois, particularly around the Quincy area. That part of the state has moved in and out of moderate to extreme drought multiple times in the past 18 months, culminating in significant drought impacts. The 2022-23 water year, spanning October 1, 2022 to September 30, 2023 was the 3rd driest on record in Quincy, nearly 15 inches below the 30-year normal. Figure 4 shows the intense dryness over the past 12-18 months spans much of the Midwest from Kansas to central Indiana.

Figure 4. Map of water year precipitation deficits across the Midwest.

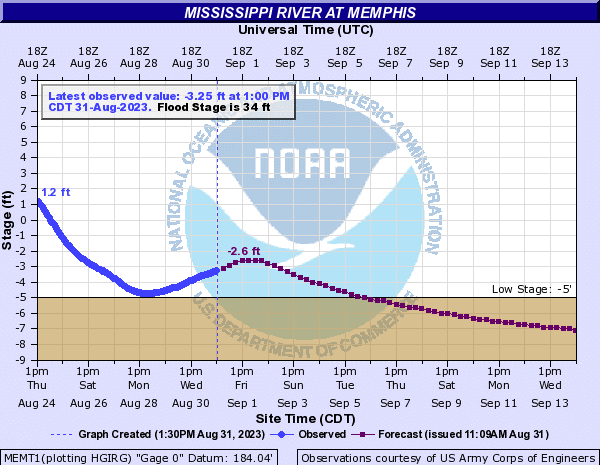
The Mississippi River has responded to the months-long Midwest drought with significantly reduced flow and near record low levels. Precipitation deficits over 12- to 18-month periods cannot be made up in a month or two, but instead require extended wetter weather over multiple seasons. Therefore, while a wet winter would be beneficial to improving soil, stream, and groundwater conditions, it is likely we’ll be coming into spring 2024 with some moisture deficits in parts of the Midwest.

Outlooks

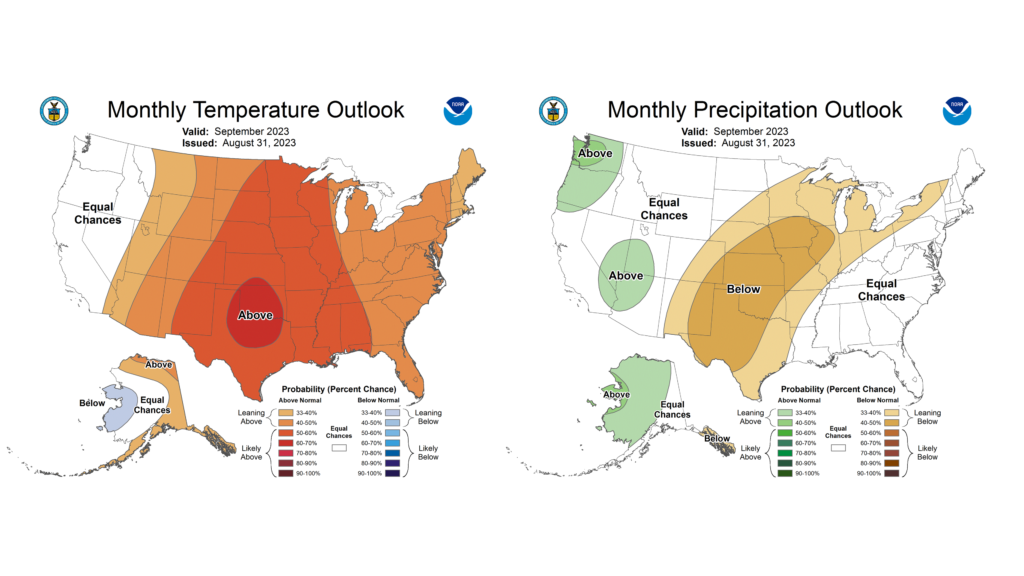
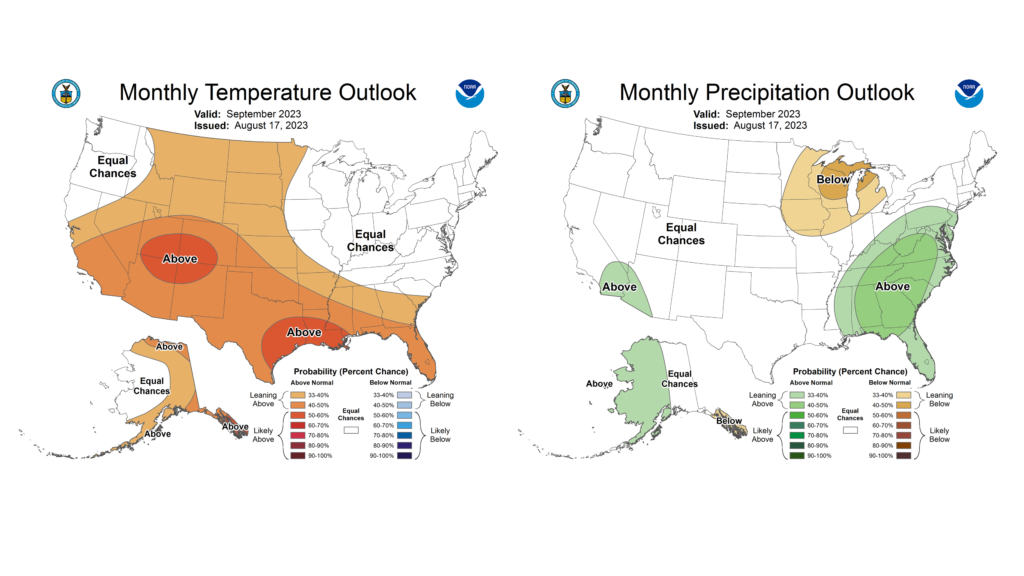
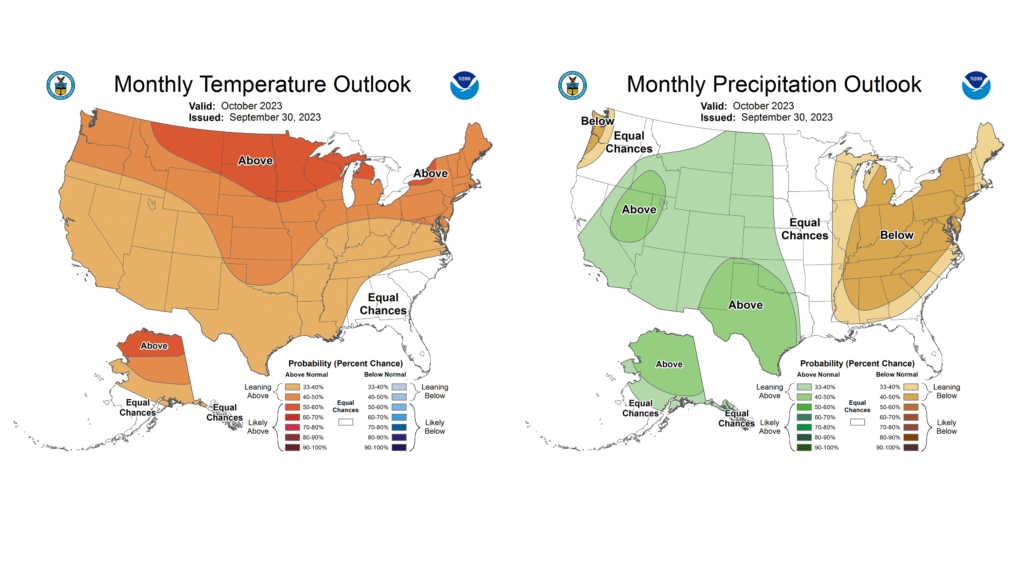
October–in my humble opinion–is the best weather month of the year. Days become noticeably shorter, nights become cooler, and hoodies and shorts become the ultimate nightwear. The Climate Prediction Center shows higher odds of a warmer and drier than normal October (Figure 5), but no doubt there will be some beautiful fall weather. 

Figure 5. Maps of (left) temperature and (right) precipitation outlooks for October.

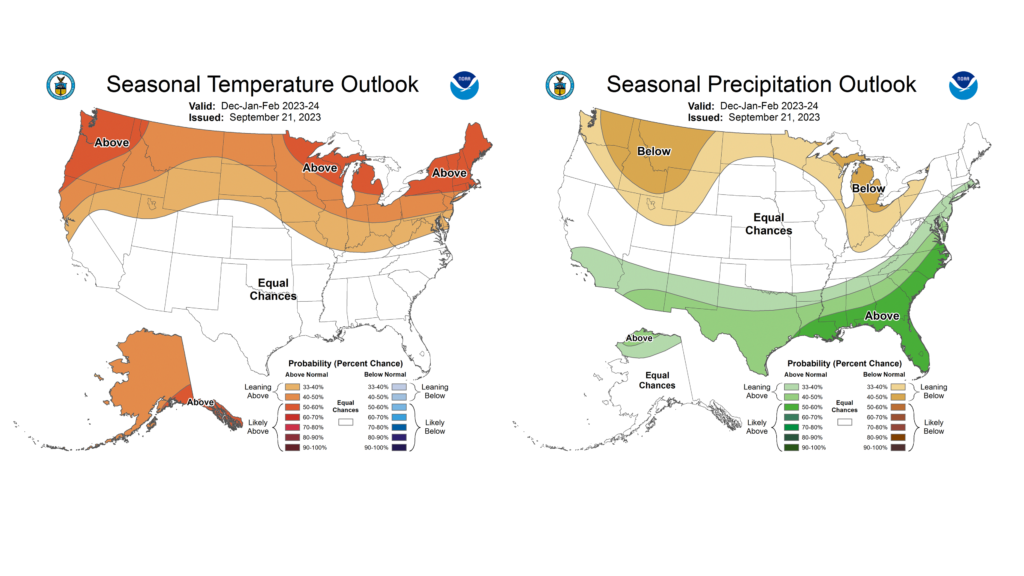
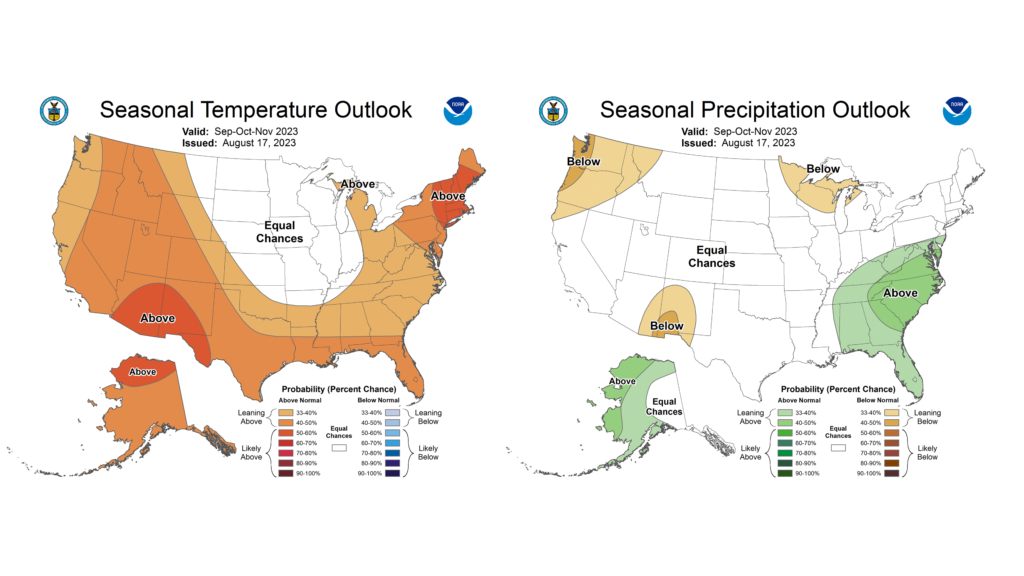
Meanwhile, October also brings in the first look at NOAA’s official winter prediction. This year, NOAA is leaning hard into El Niño with elevated chances of a warmer than normal winter season across Illinois, and slightly higher odds of drier than normal conditions in the eastern Midwest (Figure 6). It’s important to note that El Niño is an important component of seasonal climate variability in the Midwest but is only one of many important components to a winter season.

Figure 6. Maps of (left) temperature and (right) precipitation outlooks for winter (December–February).

Drought Impacts Continue into Fall

Drought re-intensified in Illinois at the end of the growing season and has increased the fire and blowing dust risk as we approach harvest. River levels have also dropped near or below low stage, increasing concerns of issues with navigation.

Working off Early August Rains

The drought peaked in early July for much of Illinois, as more active, stormy weather was present most of that month and in the first two weeks of August. Most of Illinois was 1 to 8 inches wetter than normal between mid-July and mid-August, dramatically improving soil moisture, crop conditions, and streamflow. However, drier weather has dominated since mid-August, and most of central and northern Illinois have been 1 to 4 inches drier than normal between mid-August and mid-September (Figure 1).

https://mrcc.purdue.edu/files/cliwatch/state_climatologists/illinois/mpe/IL-prcp-mpe-030-dev.png
Figure 1. Map shows 30-day total precipitation departure from normal from mid-August to mid-September.

Soil moisture down to 20 inches has been depleted once again because of the below normal rainfall. The combination of dryness and late August heat has also sped up crop senescence and possibly affected some yields in the driest parts of the state. Meanwhile, crops in areas of the state that had been wetter in early August, such as parts of central and southern Illinois, have been relying on the remaining soil moisture.

Water table levels have also dropped across the northern two-thirds of the state as soil moisture is used. Water table levels at the State Water Survey’s WARM station in Freeport dropped more than 1 foot between August 1 and September 1 (Figure 2), and current water table depths are 1.5 feet deeper than this time last year.

Figure 2. Water table depth from the surface between August 1, 2022 and September 1, 2023 at the State Water Survey’s WARM station in Freeport.

Low River Levels Across the Midwest

Drought usually affects the flow and level of small streams and creeks first, then the tributaries of our larger rivers. When dry conditions persist for weeks to months we can see low flow along our larger rivers like the Illinois, Rock, and Kaskaskia. When those drought conditions cover most of the Midwest region, we can see low flow along the region’s largest rivers like the Mississippi and Ohio. Persistently dry conditions this summer have caused concerns of low flow conditions along the Mississippi River, like the issues we saw last fall. As of September 15, the Mississippi at Memphis was 4 feet below low stage and forecasted to approach record low values by late September. The big river hit a record low of -10.81 feet on October 21, 2022, so it is concerning that we are approaching these low values a full month ahead of last year.

The problem of big river low flow is not as easily fixed as soil moisture drought. Most rain over the next few weeks would be soaked up by the soil to replenish soil moisture and groundwater, reducing runoff to the big rivers and their tributaries. Therefore, the Midwest region will need prolonged wetter conditions over the next several weeks to help reduce or avoid the impacts of low flow on our rivers.

Where are We Headed?

The September 12 edition of the U.S. Drought Monitor has over 20% of Illinois and nearly half of the Midwest region in at least moderate drought (Figure 3). Most of the worst drought issues are in the western Midwest, while the eastern corn belt remains mostly drought-free.

Figure 3. US Drought Monitor current as of September 12.

Next week looks to be very dry across most of the region, including the Ohio Valley region that often contributes significantly to the flow of the Ohio and lower Mississippi Rivers (Figure 4). Beyond that, outlooks show the best chances of warmer conditions returning for the last full week of September, but also possibly better chances of near to wetter than normal conditions in the Midwest.

Figure 4. 7-day precipitation forecast across the Midwest for the period September 15 to September 22.

Fire and Dust Risk

We are still a few weeks from harvest in full swing, but more combines are out of the shed–and some in the field–across southern and central Illinois. Recent dry weather has quickly dried corn and beans, and combined with low humidity and dry topsoil, has increased field and grass fires across the Midwest. Extra precautions should be taken ahead of, during, and after harvest to ensure everyone stays safe considering the enhanced fire risk. You can find more information on farm fire safety here: go.illinois.edu/farmfiresafety.

Additionally, the dry crop and topsoil increase the chances of blowing dust on dry and windy days. Folks should consider weather conditions and the potential dust created when harvesting. We want to avoid dangerous blowing dust situations like what we saw this spring. 

August Wraps up a Mild and Drier Summer

The preliminary statewide average August temperature was 73.5 degrees, 0.1 degree above the 1991–2020 average and tied for the 63rd coolest on record going back to 1895. The preliminary statewide average total August precipitation was 4.43 inches, 0.87 inches above the 1991–2020 average and the 29th wettest on record statewide.

Data are provisional and may change slightly over time.

Big August Heat, but Mild Weather Overall

The final month of climatological summer had mild temperatures overall, except for a very intense heat wave in the third week of August. Daily average temperature departures from Normal, IL show most August days were within 7 to 8 degrees of their normals, and more than half of August days were cooler than normal in the twin cities (Figure 1).

Figure 1. Daily August average temperature departures in Normal.

August average temperatures ranged from the low 70s in northern and central Illinois to the high 70s in southern Illinois, within 1 degree of normal statewide (Figure 2). Most parts of the state pushed into the mid- to upper 90s on August 24 and 25, and Chicago’s O’Hare airport recorded 100 degrees on August 24 for the first time in 11 years. The intense heat was followed by a fleeting taste of fall air, and many places saw nighttime temperatures dip into the high 40s, including 48 degrees at Marseilles. The warmest point in the state last month was Cahokia at 77.4 degrees, and the coolest point was Stockton at 69.7 degrees.

Figure 2. Maps of (left) August average temperature and (right) August average temperature departures from normal.

Overall, the preliminary statewide average August temperature was 73.5 degrees, 0.1 degrees above the 1991–2020 average and tied for the 63rd coolest on record going back to 1895.

Late Season Heat Wave

This summer will not go in the books as a particularly extreme season temperature-wise. Most parts of the state have seen near to slightly fewer than normal days with high temperatures exceeding 90 degrees, and early season drought helped nighttime low temperatures regularly drop out of the 70s. However, the largely mild weather was broken up by two intense heat waves, one in late July and the other this past month. A large upper-level ridge established over the central U.S. around August 20, bringing very warm air and high humidity from the southern U.S. and Gulf of Mexico. Daily high temperatures exceeded 95 to 100 degrees across most of the state on August 23 and 24 (Figure 3), and, combined with the humidity, pushed heat index values over 110 degrees statewide. Peoria set a new heat index record at 121 degrees, breaking its previous record from 1995.

The heat caused buckled roads in parts of central Illinois, stressed air conditioning units, and significantly increased energy demand across the Midwest. Both Champaign and Urbana schools were forced to close on August 24 due to malfunctioning HVAC systems and dangerously high temperatures inside some schools.

Figure 3. Map of high temperatures across Illinois on August 24.

Drought Relief for Some in August

July brought some better rain to parts of drought-stricken Illinois, yet moderate drought remained in more than half the state coming into August. A more active storm track last month helped bring in multiple systems that brought wetter weather to central and southern Illinois in August, helping to continue to relieve earlier drought conditions. Total August rainfall ranged from less than 2 inches in parts of northwest Illinois to over 10 inches in southeast Illinois (Figure 4). Most areas of the state south of Interstate 80 were 1 to 5 inches wetter than normal in August, while much of northern Illinois was 1 to 3 inches drier than normal.

Figure 4. Maps of (left) August total precipitation and (right) August precipitation departures from normal.

The dryness last month was most intense in northwest Illinois from the Quad Cities to the Wisconsin border. Freeport had its third driest August on record with only 0.80 inches–about 3 inches drier than normal–and the driest last month of summer since 1966. Meanwhile, Fairfield in southeast Illinois had its fourth wettest August on record with 8.11 inches.

Overall, the preliminary statewide average total August precipitation was 4.43 inches, 0.87 inches above the 1991–2020 average and the 29th wettest on record statewide.

Drought in Illinois

It’s safe to say that drought reached a peak in early July, and conditions across much of the state have improved since then. The August 29 U.S. Drought Monitor map has 16 percent of the state in at least moderate drought compared to over 50 percent on August 1 (Figure 5). The wetter weather in August helped improve crop and pasture conditions across the state, stabilize declining streams and pond levels, and promote ecological health in our natural lands. Despite the recovery, drought likely and significantly impacted crop yield potential this year, and its impact on tree health–especially in urban areas–will not be well known until next year. However, rain in July and August helped keep 2023 out of the same breath as the most severe drought years like 2012 and 1988. One exception to the wider drought improvement is in northwest Illinois, where drought conditions expanded in August. Crop impacts have been reported in this part of the state through August, and soils remain somewhat to very dry from the Quad Cities up to Rockford.  

Figure 5. The U.S. Drought Monitor maps as of (left) August 1 and (right) August 29.  

While drought has largely improved in Illinois, its impact to flow on the Midwest’s largest rivers remains. Dry conditions in the Upper Mississippi and Ohio Basins have led to concerns of low flow and navigation and ecology impacts along the Mississippi River. Forecasts indicate the Mississippi River at Memphis is likely to reach low stage in early September (Figure 6). Dry soils across the larger Midwest region will likely slow river stage recovery from any additional rain in early fall. Therefore, without a significant shift to wetter conditions and/or an errant tropical system moving into the region, low flow issues on the Ohio and Mississippi Rivers are likely to continue or intensify into September.

Figure 6. Plot shows current and forecasted levels on the Mississippi River at Memphis.

Summer in Illinois

Climatological summer encompasses June, July, and August, and the season often brings more than its fair share of intense weather. This past season was on the mild side, temperature-wise, and was somewhat to much drier than normal. The abundance of gray in the maps in Figure 7 indicates average temperatures in all three summer months were mostly within 1 degree of normal across the state. While the Midwest was exposed to ephemeral heat in July and August, persistent extreme high temperatures stayed well south, making for one of the hottest summers on record in parts of Texas and New Mexico.

Figure 7. Maps show average temperature departures for June, July, August, and climatological summer.

The summer season began with a very dry June that kicked off drought concerns across the state. Wetter conditions in July and August helped reduce or eliminate drought in central and southern Illinois, but parts of northern Illinois remained dry in the latter part of the season. Summer precipitation totals ranged from 6 inches in parts of northwest Illinois to over 20 inches in parts of southeast Illinois. Most of the northwest part of the state was 4 to 8 inches drier than normal in summer, while much of southern Illinois was 2 to 10 inches wetter than normal (Figure 8).

This past season was the 13th driest summer on record in Moline with 6.89 inches, and the driest since 2012. It was also the 20th driest summer on record in Rockford with 7.63 inches, which is less than half of the summer total from last year. Three of the past four years have seen top 20 driest summers in Rockford. In contrast, this summer was one of the wettest in far southern Illinois, and it was the fifth wettest on record in Paducah, Kentucky with 18.90 inches.

Figure 8. Maps show (left) summer total precipitation and (right) summer precipitation departure from normal.

Overall, the preliminary statewide average summer temperature was 73.4 degrees, 0.4 degrees below the 1991–2020 average and tied for the 57th coolest on record going back to 1895. The preliminary statewide average total summer precipitation was 11.51 inches, 0.76 inches below the 1991–2020 average and the 69th driest on record statewide.

Outlooks

September brings in what is undoubtedly the best season in Illinois. However, outlooks for the month of September suggest we may need to wait a bit for more consistent fall weather, with higher odds of warmer and drier than normal weather for the first month of the season (Figure 9a). Meanwhile, guidance for climatological fall is less than confident, with equal chances of warmer, cooler, wetter, and drier than normal weather. 

Figure 9. Maps show (left) temperature and (right) precipitation outlooks for the month of September and the fall season (September-November).

Drought Eases in Illinois

The 2023 drought has been the most extensive and intense in Illinois in the last 10 years. In mid-July, two-thirds of the state was in at least moderate drought, which caused significant impacts to crops, ecology, streams and rivers, and lake levels. Fortunately, most of the state has been considerably wetter since mid-July, providing some relief to drought conditions.

Recent Rainfall

Most of the state saw near to much wetter than normal conditions since mid-July (Figure 1). Isolated spots of central Illinois and virtually all of far southern Illinois was 5 to 8 inches wetter than normal over the past 30-days, while much of central and northeast Illinois were 1 to 3 inches wetter than normal. Some parts of northwest and central Illinois remained 1 to 2 inches drier than normal since mid-July, but the combination of at least some rain and mild temperatures helped reduce drought extent and severity statewide.

Figure 1. Maps show (left) total precipitation and (right) precipitation departure from normal from mid-July to mid-August.

The recent wetter conditions have helped improve drought extent and severity. The August 15th US Drought Monitor map shows only 15% of the state in at least moderate drought, down from 65% in mid-July and over 90% in late June (Figure 2). The quick improvement in the Drought Monitor over the past 4 weeks matches the rapid onset of this year’s drought between that was driven by a very dry June.

Heat and Dryness on the Way

Soil moisture has increased substantially across the state in the first half of August. Having plant available water in the soil will be particularly improvement as we head to a period of very hot and dry weather in Illinois. The 7-day Weather Prediction Center forecast shows very little, if any rain coming to Illinois through August 24 (Figure 3). The dryness is due to a very large area of high pressure that will likely set-up in the central US. The big weather change will also bring in much higher temperatures, with daily highs possibly in the mid- to upper-90s for several days. The combination of dry and hot weather will stress crops and ecology, which is why our wetter soils are so important moving into next week.

Figure 3. The 7-day precipitation forecast from the NOAA Weather Prediction Center, current as of August 17.

It’s important to note that some parts of the state have not seen as much improvement since the beginning of August, and we’ll likely see drought impacts worsen in those places next week.

Beyond next week, the latest Climate Prediction Center outlooks show higher chances of drier than normal conditions in northern Illinois and much of the Upper Midwest carrying over into September (Figure 4). September and October tend to be the time of the year with the overall lowest streamflow on large rivers such as the Mississippi and Illinois. Recent rain has greatly improved streamflow conditions along these and other rivers, but a potential shift to drier conditions in the Upper Mississippi basin could increase the risk of low-flow conditions south of St. Louis or Cairo moving into fall. This is something to watch as we move into September.

Figure 4. Maps show Climate Prediction Center September outlooks for (left) temperature and (right) precipitation.

As we move ahead into a hot and dry week, and farther out as summer transitions to fall, it is very important to continue monitoring and reporting drought conditions and impacts. Folks should continue reporting what they’re seeing from drought using the Condition Monitoring Observer Reporting (CMOR) system: go.illinois.edu/cmor.