The preliminary statewide average December temperature was 39.2 degrees, 7.6 degrees above the 1991–2020 average and the 3rd warmest on record going back to 1895. The preliminary statewide average total December precipitation was 2.99 inches, 0.56 inches above the 1991–2020 average and the 30th wettest on record statewide.
Data are provisional and may change slightly over time.
Where is Winter?
For the second time in three years Illinois has experienced an extremely mild December. All but three days last month were warmer than normal in Decatur, and several days in the second and fourth weeks of the month were 10 to 20 degrees warmer than normal (Figure 1).
Figure 1. Daily December average temperature departures in Decatur.
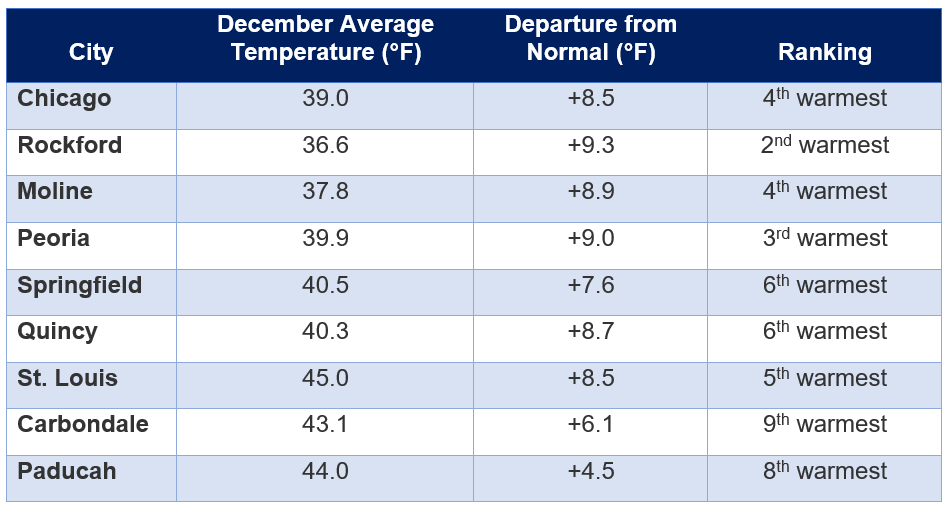
Table 1 shows the December average temperature, departure from normal, and ranking for several locations in Illinois. Last month was the 2nd warmest December in Rockford, the 3rd warmest in Peoria, and the 4th warmest in Chicago and Moline. None of the 120+ National Weather Service stations in Illinois recorded a low temperature in the single digits last month, and many places hit the freezing mark only a handful of nights.
Table 1. December average temperature, departure from normal, and ranking in several places in Illinois.
When taken altogether, December average temperatures ranged from the low 30s in northern Illinois to the low 40s in southern Illinois, between 6 and 10 degrees above normal (Figure 2). The warmest place in the state last month was Du Quoin with an average December temperature of 46.1 degrees. The coolest place in the state was Stockton in Jo Daviess County with an average December temperature of 33.9 degrees. It is important to note that the nighttime low temperatures last month were much higher than normal. The preliminary average December minimum temperature in Illinois is 32.2 degrees, which would be the 2nd highest on record statewide.
Figure 2. Maps of (left) December average temperature and (right) December average temperature departures from normal.
The mild weather last month broke 20 daily high maximum temperature records and an incredible 99 daily high minimum temperature records. No daily low maximum or daily low minimum temperature records were broken last month.
Overall, the preliminary statewide average December temperature was 39.2 degrees, 7.6 degrees below the 1991–2020 average and the 3rd warmest on record going back to 1895.
Split December Precipitation Pattern
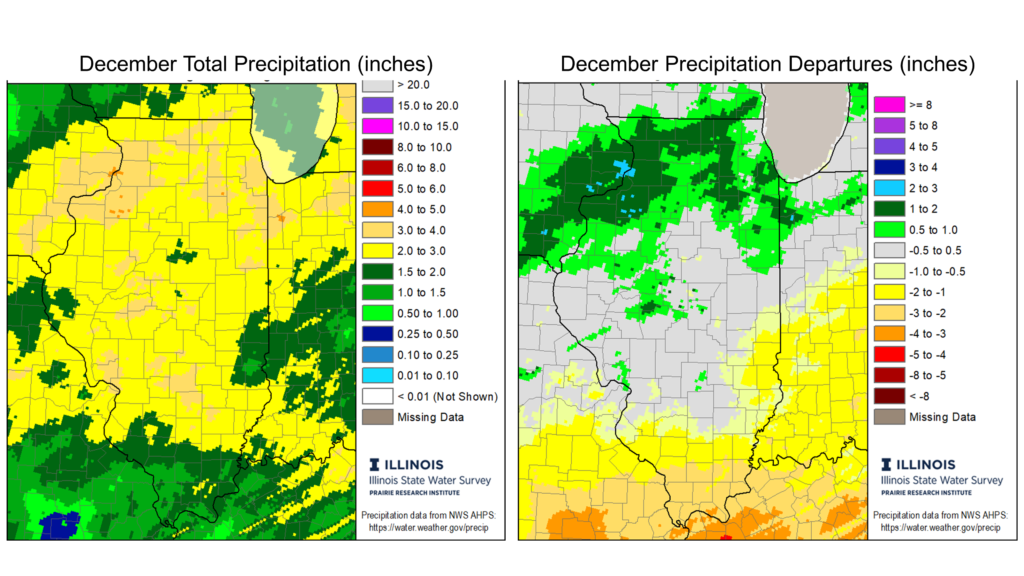
The first month of climatological winter brought a more active storm track to the Midwest than for most of fall. December total precipitation ranged from just over 4 inches in parts of northern Illinois to less than 1 inch in parts of far southern Illinois. Most of northern Illinois was around 1 inch wetter than normal, while most of the state south of Interstate 64 was 1 to 3 inches drier than normal in December (Figure 3).
Figure 3. Maps show (left) December total precipitation and (right) December precipitation departure from normal.
Overall, the preliminary statewide average total December precipitation was 2.99 inches, 0.56 inches above the 1991–2020 average and 30th wettest on record statewide.
As is often the case in milder Decembers, snowfall was hard to come by across Illinois last month. December total snowfall ranged from around 4 inches in far northwest Illinois to less than a tenth of an inch in southern Illinois, between 1 and 8 inches below normal (Figure 4).
Figure 4. Maps show (left) December snowfall totals and (right) December snowfall departures from normal.
Outlooks
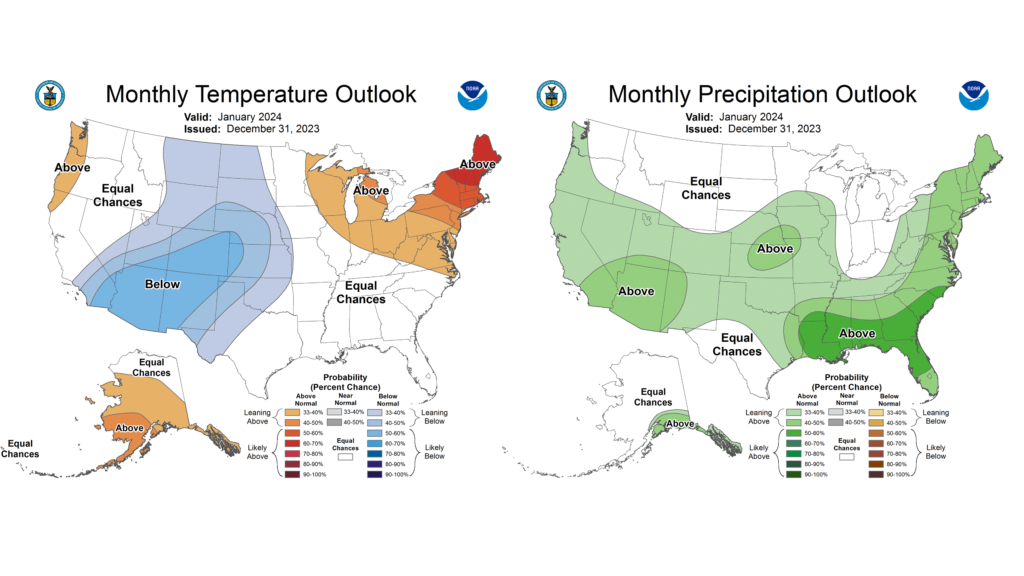
Climate Prediction Center outlooks for January are a bit different than the El Niño-esque patterns we’ve seen recently. Outlooks show mostly equal chances of above and below normal temperatures and precipitation for the first month of the season (Figure 5).
Figure 5. Maps show (left) temperature and (right) precipitation outlooks for January.
The preliminary statewide average November temperature was 42.3 degrees, 0.1 degree above the 1991–2020 average and tied for the 46th warmest on record going back to 1895. The preliminary statewide average total November precipitation was 0.74 inches, 2.34 inches below the 1991–2020 average and the eighth driest on record statewide.
Data are provisional and may change slightly over time. The official November precipitation total may be affected by the rainfall on the evening of November 30. Depending on if this precipitation is counted as on November 30 or December 1, which varies by the station, the official November total may be higher than the preliminary.
Mild November with a Chilly End
November can be a challenging month for those yearning for summer to come back. However, as daily average temperature departures in Dixon show, the past month brought mostly mild temperatures that felt more like mid-fall than early winter (Figure 1). Several days in the second and third weeks of the month were 5 to 10 degrees warmer than normal. Black Friday brought a big temperature change on the back of a strong cold front. The last week of the month saw temperatures that that were 5 to 15 degrees below normal, including several nighttime low temperatures in the single digits.
Figure 1. Daily November average temperature departures in Dixon.
November temperatures ranged from the high 40s in northern Illinois to the high 50s in southern Illinois, around 1 degree above normal (Figure 2). Several places saw high temperatures into the 80s in early to mid-November, including 84 degrees in Lawrenceville and 82 degrees in Cahokia. Meanwhile, the last week of the month brought some extremely low temperatures, including 3 degrees in Minonk and 4 degrees in Aurora. The coldest point in the state last month was Elizabeth at 36.6 degrees, and the warmest point was Lawrenceville at 49.1 degrees.
Figure 2. Maps of (left) November average temperature and (right) November average temperature departures from normal.
Where is that November Rain?
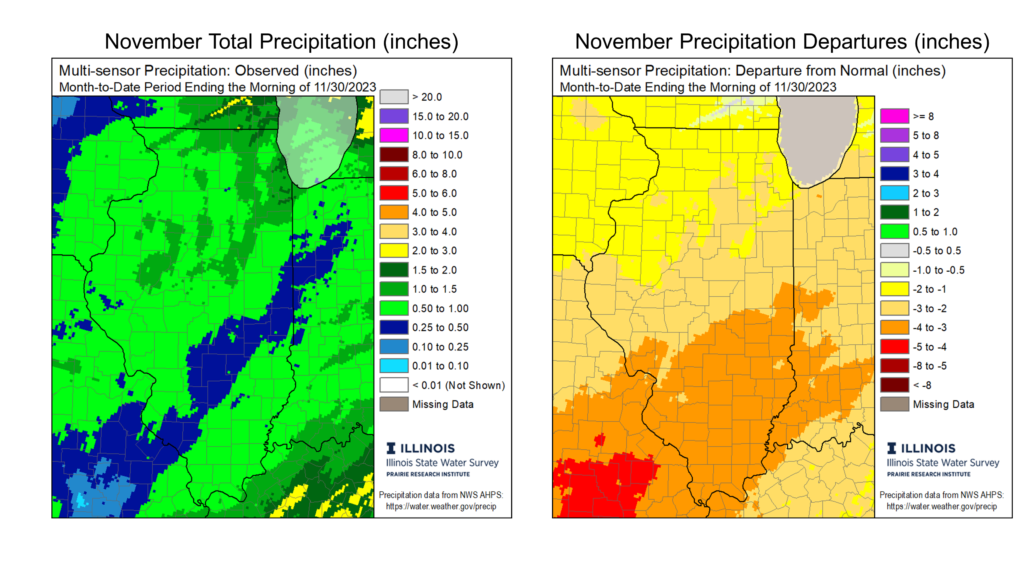
Most of Illinois got a good shot of rain in late October and saw its first snow around Halloween. However, the state moved into a much drier weather pattern that persisted for most of November. Month-total precipitation ranged from nearly 3 inches in northeast Illinois to less than half an inch in parts of south-central Illinois. Northern Illinois was 1 to 2 inches drier than normal, and southern Illinois was 3 to 4 inches drier than normal (Figure 3). Last month was a top five driest November in several places in the state, including the second driest on record in Fairfield (Table 1).
Figure 3. Maps show (left) November total precipitation and (right) precipitation departure from normal across Illinois.
Table 1. November total precipitation and historical ranking at several locations in Illinois.
Location
November Total Precipitation (inches)
Historical Ranking
Danville
0.52
3rd driest
Fairfield
0.60
2nd driest
Champaign
0.64
5th driest
Joliet
0.70
4th driest
Carbondale
0.43
4th driest
Quincy
0.36
8th driest
Chicago
0.85
12th driest
Centralia
0.52
4th driest
Freeport
0.71
8th driest
Overall, the preliminary statewide average total November precipitation was 0.74 inches, 2.34 inches below the 1991–2020 average and the eighth driest on record statewide.
Fall in Illinois
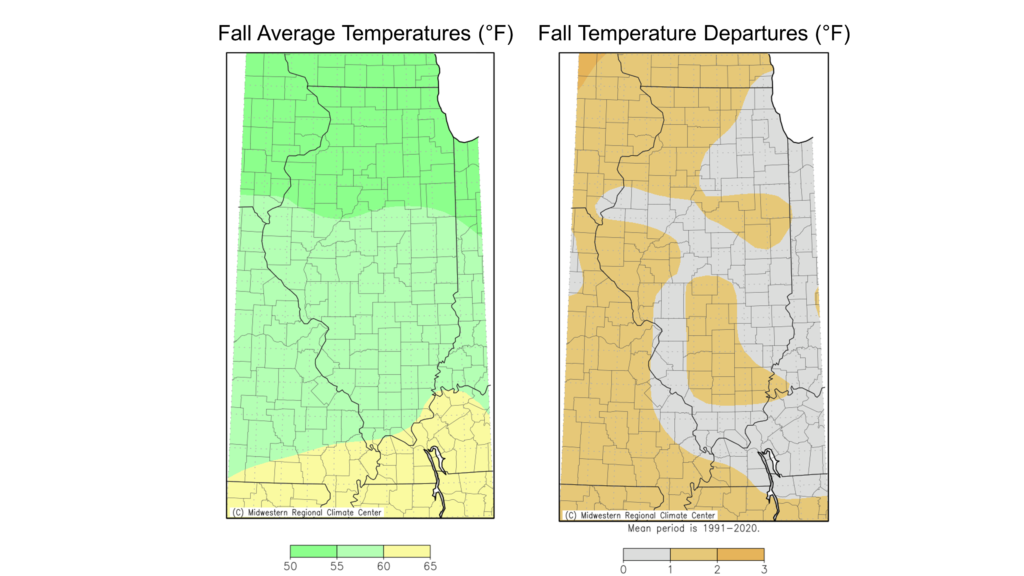
Climatological fall includes September, October, and November, and–for my money–it is the best weather season Illinois has to offer. This past season’s average temperatures ranged from the low 50s in northern Illinois to the low 60s in southern Illinois, around 1 degree above normal (Figure 4).
Figure 4. Maps show (left) average temperatures and (right) temperature departures for climatological fall.
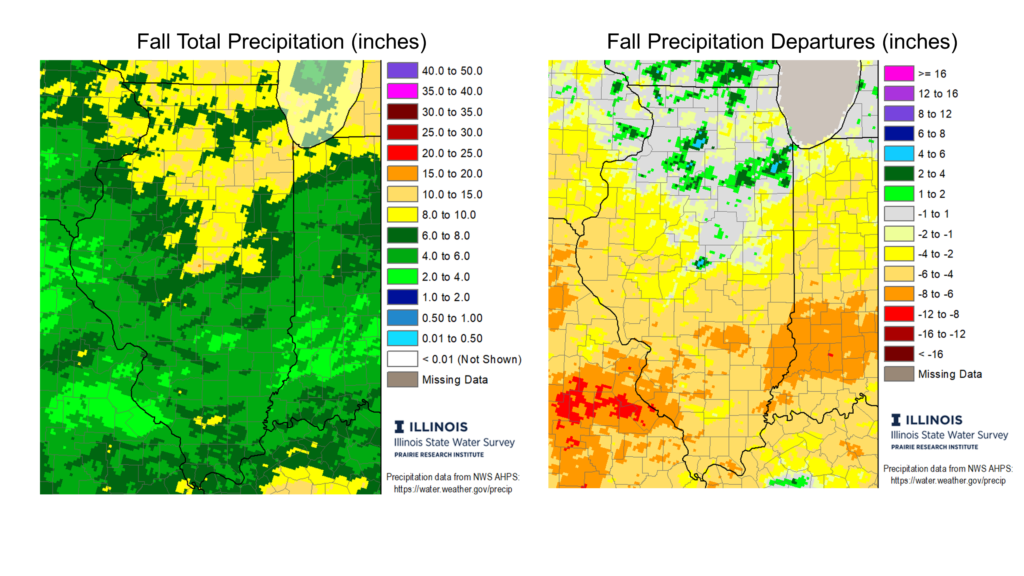
Fall season total precipitation ranged from over 15 inches in northern Illinois to less than 4 inches in parts of southwest Illinois. The season was near 1 to 2 inches wetter than normal in northern and parts of central Illinois and was 4 to 8 inches drier than normal in southern Illinois. Last season was the driest fall on record in Chester, with a record back to the 1890s, and it was the fourth driest fall on record in Quincy and the driest since 1956. Speaking of Quincy, Gem City is well on its way to a top five driest calendar year of its 120+ year record. Drought has consequently been a constant in much of western Illinois this year, causing agriculture and water resource impacts.
Figure 5. Maps show (left) maps of total fall season precipitation and (right) fall precipitation departures from normal.
Overall, the preliminary statewide average fall temperature was 55.7 degrees, 1.1 degrees above the 1991–2020 average and tied for the 27th warmest on record going back to 1895. The preliminary statewide average total fall precipitation was 6.87 inches, 2.82 inches below the 1991–2020 average and the 30th driest on record statewide.
Fall Snow
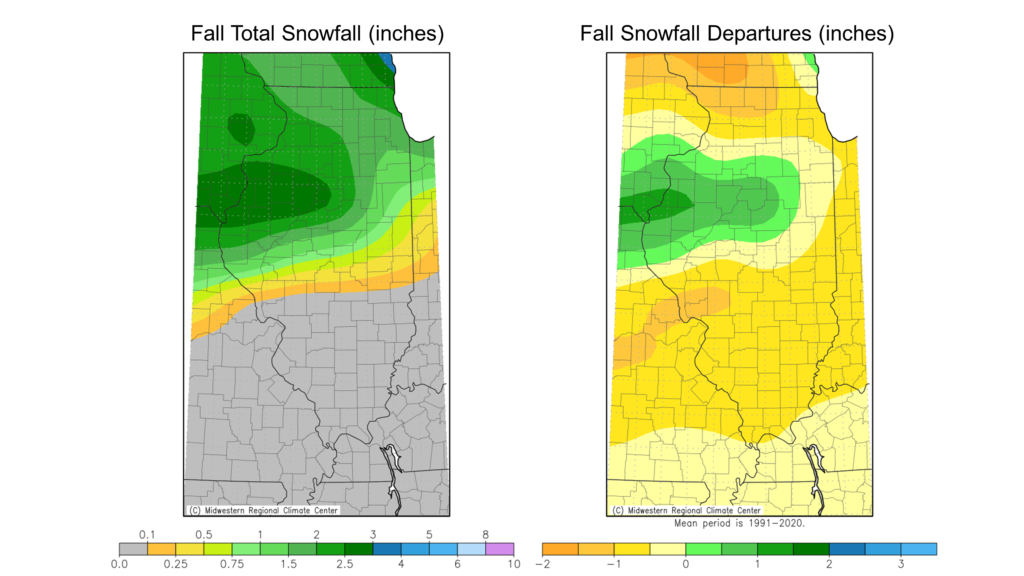
Snowfall before December is typical for central and northern Illinois, and, unlike post-March snowfall, is not universally despised. Most of northern Illinois saw its first measurable snowfall around Halloween, while central Illinois had to wait until the weekend after Thanksgiving to see the white stuff accumulate. Fall season snow totals ranged from a tenth to a quarter of an inch along the Interstate 72 corridor up to 5 inches between Peoria and Monmouth (Figure 6). Most of the state outside of the Peoria to Monmouth corridor is a little less than 1 inch beyond on season-to-date snowfall, thanks to milder October and November temperatures. It’s important to note that neither an early start to snowfall nor unusually high snow totals before December forewarn snowfall between December and February.
Figure 6. Maps show (left) season-to-date snowfall total and (right) snowfall departures from normal.
Outlooks
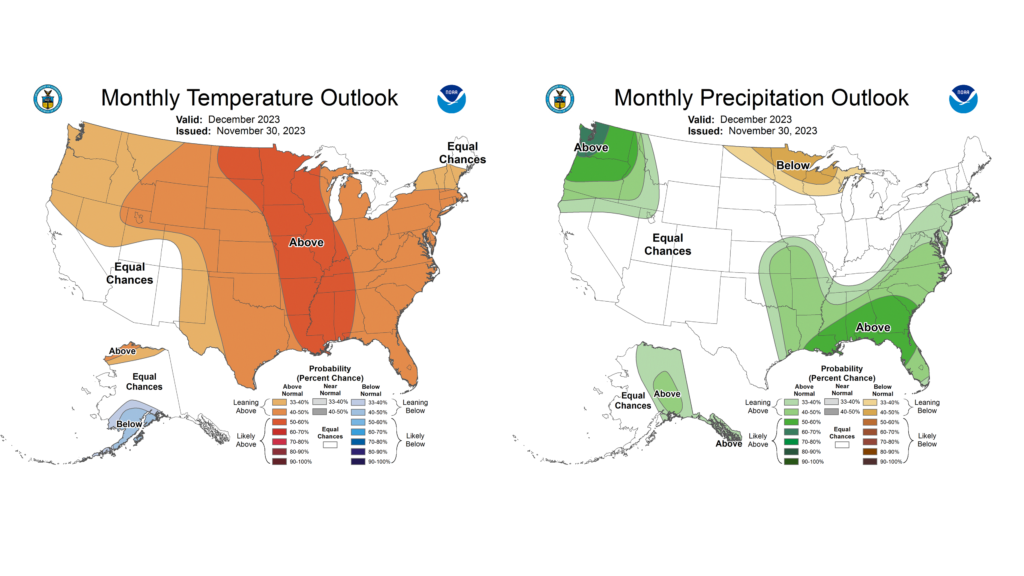
Welcome to winter! December brings in the coldest, snowiest season of the year. However, this winter also comes with a moderate-to-strong El Niño, which often moderates winter temperatures and limits snowfall. The December outlooks lead into that pattern, with the highest chances of above normal temperatures for the final month of the year (Figure 7a). Not much changes in the winter season (December–February) outlooks, with the highest chances of both warmer than normal and drier than normal conditions across the state (Figure 7b).
Figure 7. Maps show (left) temperature and (right) precipitation outlooks for (top) the month of December and (bottom) the winter season (December–February).
The USDA released their new Plant Hardiness Zone map, which shows significant changes in Illinois’ hardiness zones, reflecting the impact of human-caused climate change. The newest Illinois maps is available here.
The Zones They Are A-Changin’
Plant hardiness zones represent the best estimate of the average annual extreme minimum temperature at any location and are based on temperature data over a particular time period, often 30 years. The newest hardiness zone map is based on weather data from 1991 to 2020, and like earlier versions, is divided into 13 zones across the United States.
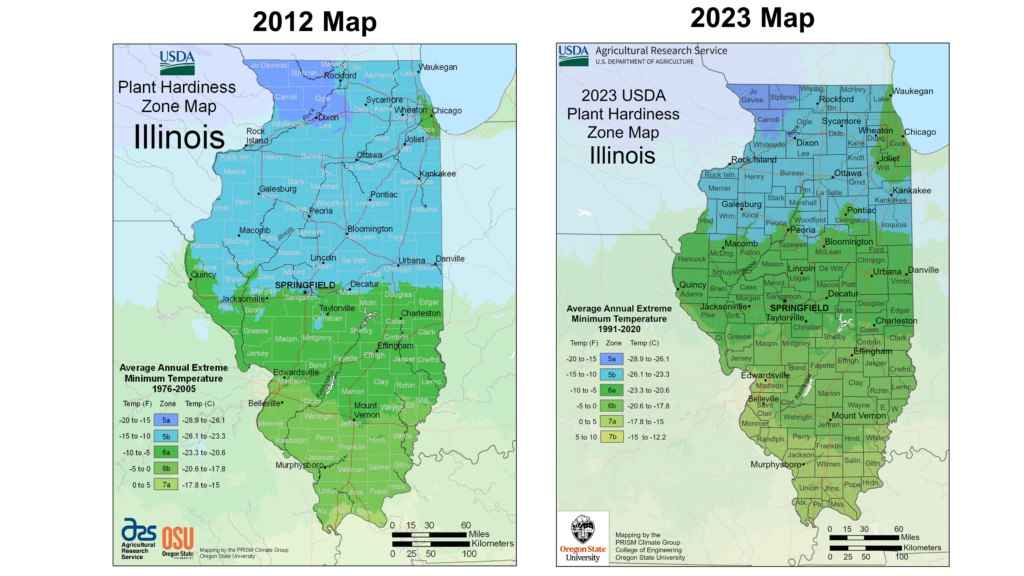
The most obvious change between the new hardiness zone map and the 2012 map is a northward progression of zones 6a-6b and 7a (Figure 1). The boundary between zones 5b and 6a, representing an average annual extreme minimum temperature of -10°F, migrated 60 to 70 miles north, from around Springfield in the 2012 map to around Peoria in the 2023 map. The boundary between zones 6b and 7a, representing an average annual extreme minimum temperature of 0°F, migrated 40 to 50 miles north from Cairo in the 2012 map to the St. Louis Metro East area in the 2023 map. And for the first time we see a small sliver of zone 7b in the southern tip of Illinois. We also see an expansion of zone 6a around the broader Chicagoland area, spanning from Lake County to Kankakee County. The 6a expansion in northeast Illinois is likely due to a combination of long-term winter warming and urban sprawl and development in the region.
Figure 1. Maps show USDA hardiness zone maps in Illinois from (left) 2012 and (right) 2023.
An Unmistakable Climate Change Signal
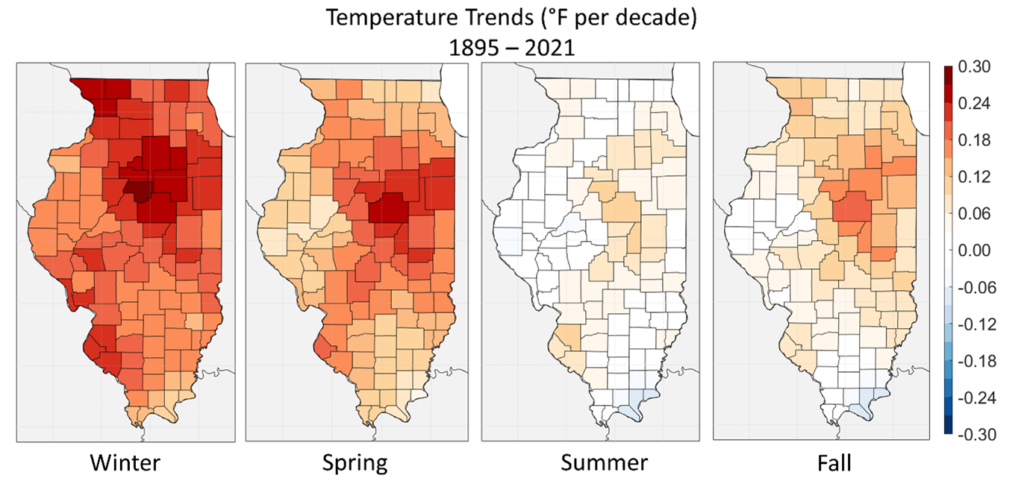
One of the most consistent changes in Illinois’ climate that is directly linked to human-caused global warming is warming winters. In fact, climatological winter (December – February) average temperatures have increased faster than any other season over the past century (Figure 2a). In the winter, though, nighttime low temperatures have increased at a faster rate than daytime high temperatures. Furthermore, the most extreme low (i.e., cold) winter nighttime temperatures have increased faster than milder winter temperatures (Figure 2b). Practically, these changes have noticeably decreased the frequency and intensity of extreme cold and the risk of cold exposure for plants, animals, and humans.
There are benefits of less extreme winter cold, including a reduced risk of human health impacts and cold injuries to perennial crops and natural ecosystems. However, the obvious change in winter temperature across Illinois–as exemplified by these new maps–also brings significant shifts in plant and animal habitat suitability. Warmer winters, embedded in an overall warmer and wetter Illinois, may be more conducive to certain species of non-native, invasive plants, pests, and plant and animal diseases and vectors. We have seen recent examples of impacts from changing environment, habitat, and climate in Illinois, including growing incidences of ticks and tar spot.
Figure 2. Top panels show the season average temperature change between 1895 and 2021 by county. The bottom panel shows the distribution of daily nighttime low temperatures in winter in Chicago, separated by 30-year periods since 1951.
What About Variability?
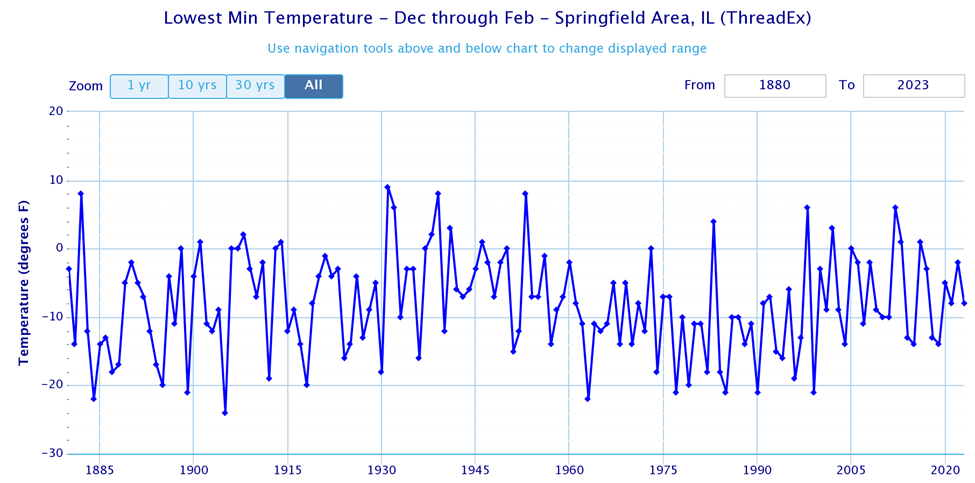
The USDA hardiness zone maps represent average extreme winter temperatures, but do not explicitly account for year-to-year variability. For example, Springfield, which is squarely in zone 6a (-5 to -10°F) in the most recent map, experienced nighttime low temperatures below -10°F in 11 of the 30 years between 1991 and 2020. This means that while the average Springfield winter may be suitable for plants that can survive temperatures as low as -10°F, it is likely the city will experience temperatures below that threshold in multiple years over the next three decades. However, the overall frequency and intensity of these extreme winter temperatures in Springfield, and across Illinois, are decreasing. Therefore, the transition to a warmer winter climate in Illinois also comes with large year-to-year variability, which makes conservation and agricultural management more demanding. Significant damage to Illinois peaches from extreme cold in an otherwise mild winter last year is an example of this variability and its problems. Overall, winter climate change in Illinois is messy, and will continue to challenge farmers, gardeners, conservation professionals, and anyone else working hard to grow plants in the prairie state.
Figure 3. Plot of annual lowest nighttime temperature in Springfield since the 1880s.
The preliminary statewide average October temperature was 56.7 degrees, 1.9 degrees above the 1991–2020 average and tied for the 31st warmest on record going back to 1895. The preliminary statewide total October precipitation was 3.46 inches, 0.20 inches above the 1991–2020 average and the 41st wettest on record.
Data are provisional and may change slightly over time.
Mild October Temperatures with Some Extremes Thrown In
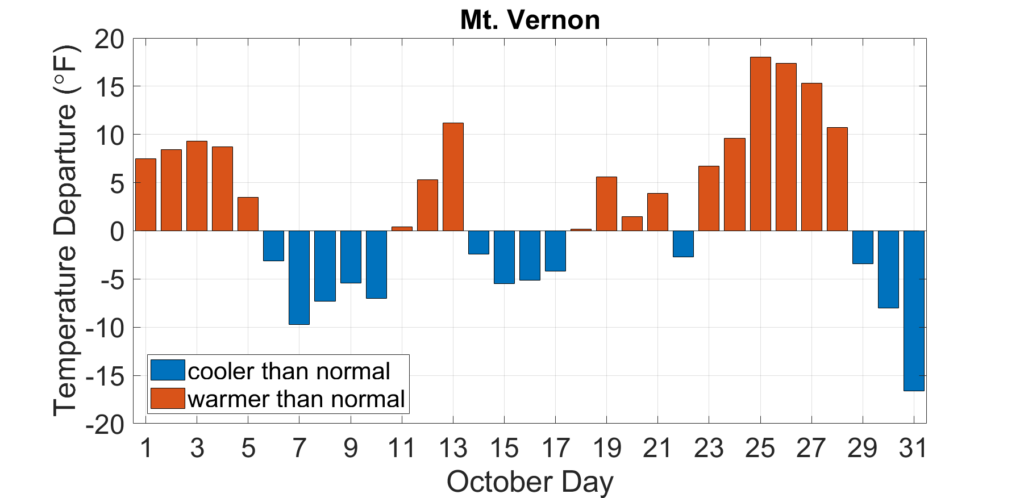
For my money, October is the best weather month of the year. The summer heat mellows out and mixes with the first real shots of chilly air. We had both summer- and winter-like weather last month, but a little more of the former than the latter. As the daily temperature departures from normal in Mt. Vernon show, most October days had above average temperatures, including a few days in the final week of the month that were 15 to 20 degrees above normal (Figure 1).
Figure 1. Daily October average temperature departures in Mt. Vernon.
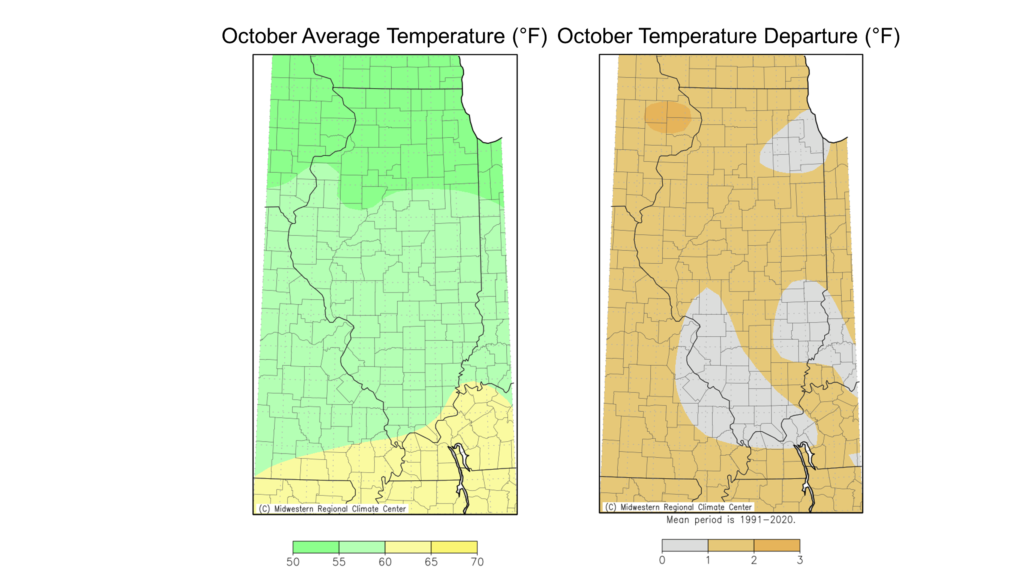
October average temperatures ranged from the low 50s in northern Illinois to the low 60s in southern Illinois, between 1 and 2 degrees above normal in most places (Figure 2). Most of the state saw high temperatures in the upper 80s or low 90s in early October, including 94 in Quincy and 90 in Hoopeston. The brief taste of winter in the last few days of the month brought widespread low temperatures in the low 20s, including 21 degrees in Mt. Vernon and 23 in Bloomington.
The warm periods last month broke 31 daily high maximum temperature records and an incredible 66 daily high minimum temperature records. Aledo in Mercer County broke its all-time October high temperature records last month with a high temperature of 93 degrees on October 3. The cold end to the month broke 18 daily low maximum temperature records and 37 daily low minimum temperature records.
Figure 2. Maps of (left) October average temperature and (right) October average temperature departures from normal.
Overall, the preliminary statewide average October temperature was 56.7 degrees, 1.9 degrees above the 1991–2020 average and tied for the 31st warmest on record going back to 1895.
Dry Start and Wet End to October
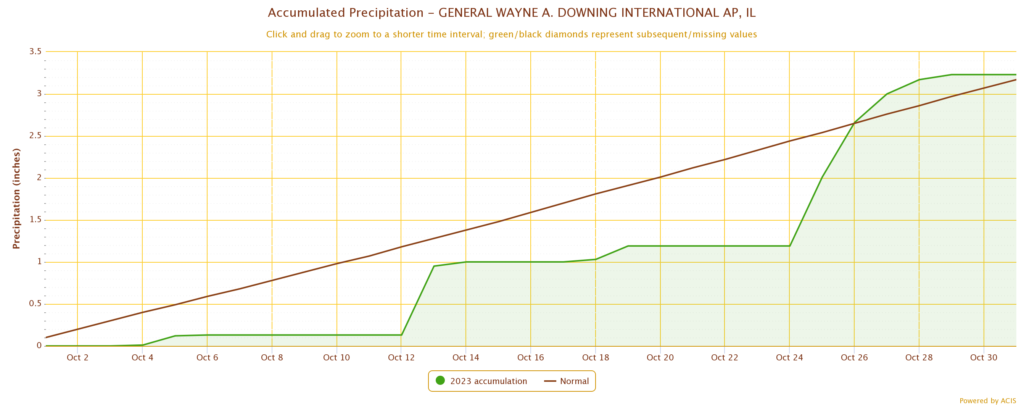
The month-end precipitation totals across the state do not tell the entire story of October precipitation. The first two-thirds of the month were somewhat to very dry across the state, as most places were 1 to 2 inches drier than normal through October 24. More active weather brought multiple rounds of rain–and some snow–to Illinois, raising month-end totals near or above the 30-year normals. As Figure 3 shows, Peoria picked up more rain in the last 7 days of October than in the first 24 days, and the month ended just slightly wetter than normal in Peoria. The dry start to the month was ideal for fall harvest, while the wetter end of the month helped improve dry conditions that prevailed in August and September.
Figure 3. Plot of October daily precipitation accumulation in Peoria (shaded area) versus the normal daily accumulation (black line).
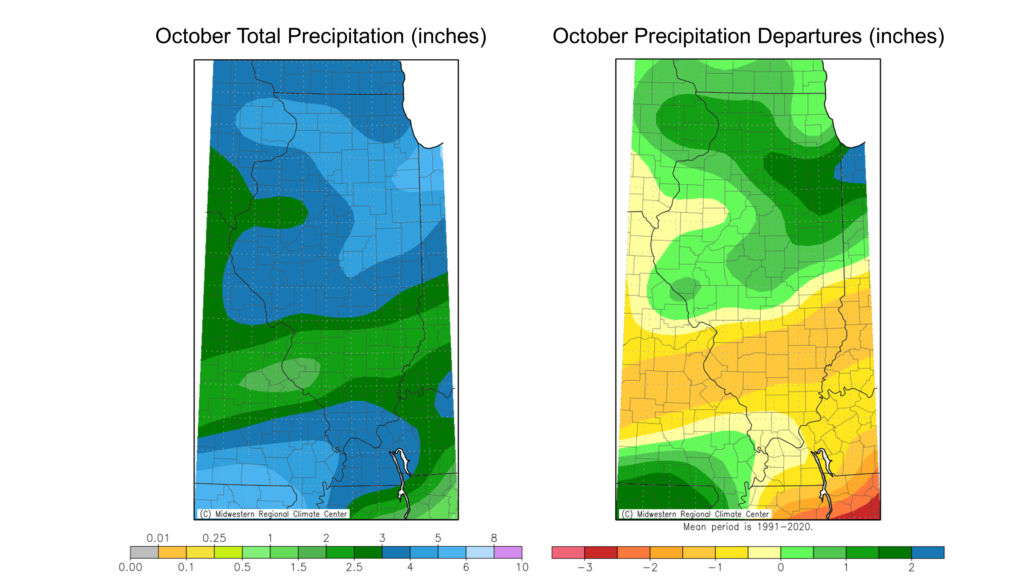
October precipitation ranged from nearly 6 inches in northeast Illinois to less than 2.5 inches in the St. Louis Metro East. Most of the state north of Interstate 70 was 1 to 2 inches wetter than normal, while areas farther south were just slightly drier, up to 2 inches drier than normal (Figure 4).
Figure 4. Maps show (left) October total precipitation and (right) October precipitation departure from average.
Last month wasn’t an extremely wet or extremely dry month anywhere in the state; however, the wetter conditions in the northern half of the state helped reduce drought extent from 23 percent of the state on October 3 to 7 percent on October 31. Small areas of western and southern Illinois remain in moderate drought due to longer-term precipitation deficits. For example, the first 10 months of the year have had the third lowest precipitation total in Quincy with 20.17 inches, around 10 inches below average. While topsoil moisture in western Illinois has improved from the wetter end of October, deeper layer moisture and water table levels remain less than ideal because of the long-term dryness.
Overall, the preliminary statewide total October precipitation was 3.46 inches, 0.20 inches above the 1991–2020 average and the 41st wettest on record.
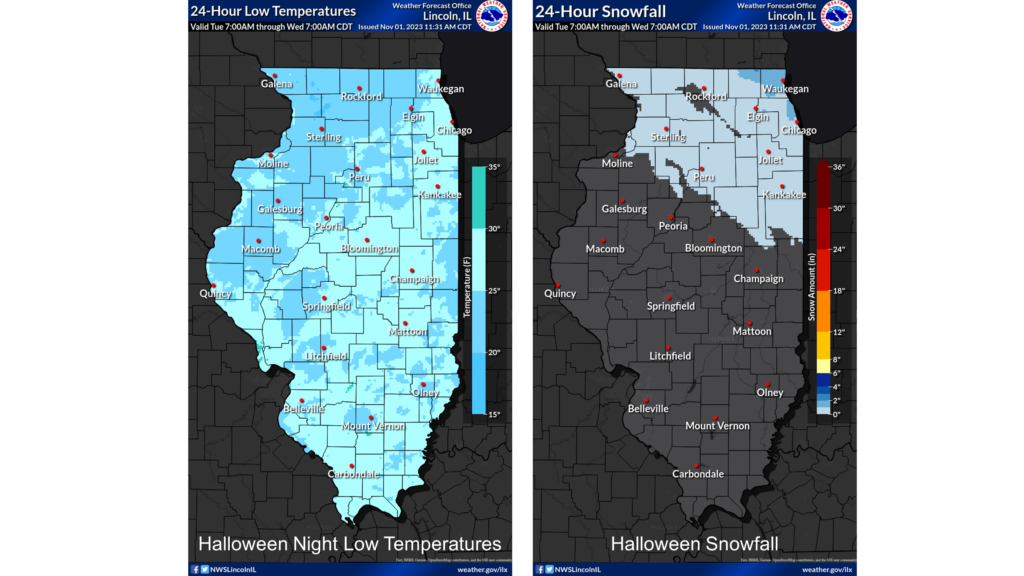
A Spooky, Winter-y Halloween
Like all the horror film characters who inevitably run back into the haunted house, mild October temperatures lulled all of us into a false sense of security. The intense cold, wind, and for some folks, snow on Halloween was more shocking than the sound of a revving chainsaw. Halloween nighttime temperatures dipped into the low 20s and high teens across much of the state, including 18-degree lows in Monmouth and Rochelle (Figure 5). The daytime high temperatures on Halloween were the coldest on record in several spots across the state, including at Chicago’s Midway airport (37 degrees) and Mt. Vernon (43 degrees). The low temperatures on Halloween night also set records in many places, including in Kankakee (24 degrees) and Olney (22 degrees). In fact, this year was the coldest Halloween in Olney since observations began there in 1896.
Halloween snow in northern and central Illinois is not necessarily a rarity but happens once every 4 to 6 years. Measurable snow, with totals exceeding 0.1 inches, was recorded in much of the state north of Interstate 74, with totals as high as 1.5 inches in Mundelein and 0.9 inches at O’Hare (Figure 5). For reference, the average first measurable snow comes in the third or fourth week of November for most of northern and central Illinois, so this year’s event came about two to three weeks early. It’s important to note that an early snowfall does not mean we will necessarily have a very snowy winter… but this State Climatologist can hope.
Figure 5. Maps of (left) nighttime low temperatures and (right) total snowfall on Halloween. Maps are from the Lincoln National Weather Service Office: https://www.weather.gov/ilx/illinois-daily.
Outlooks
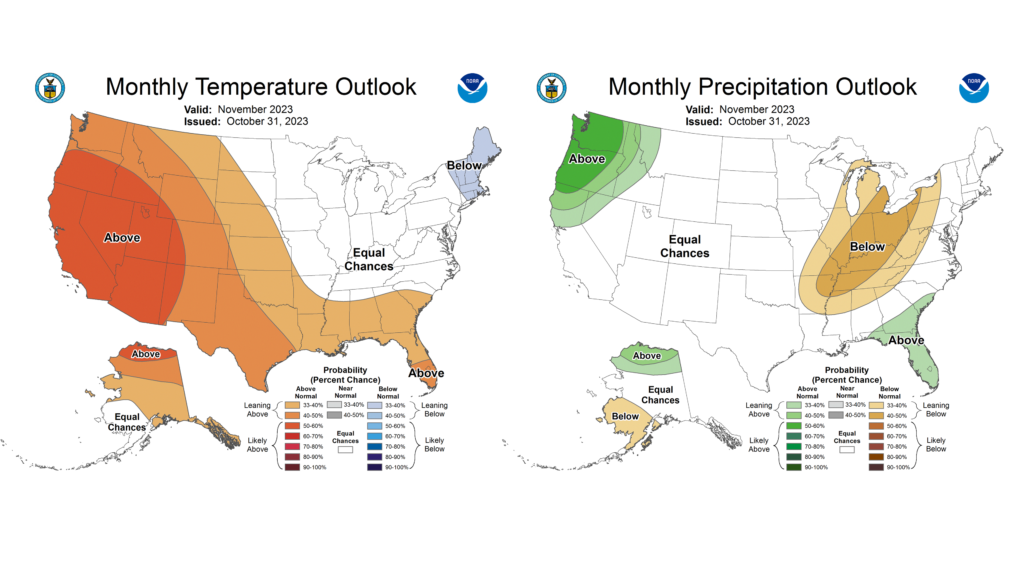
November doesn’t get the love it deserves, because it is so often associated with cloudy, blustery weather. But November typically gives us a great mix of pleasant and not-so-pleasant weather and portends the beautiful winter season in Illinois. The latest Climate Prediction Center outlooks lean into El Niño with higher chances of below normal November precipitation. November temperature outlooks are more mixed, with equal chances of warmer and colder weather this month (Figure 6).
Figure 6. Maps of (left) temperature and (right) precipitation outlooks for November.
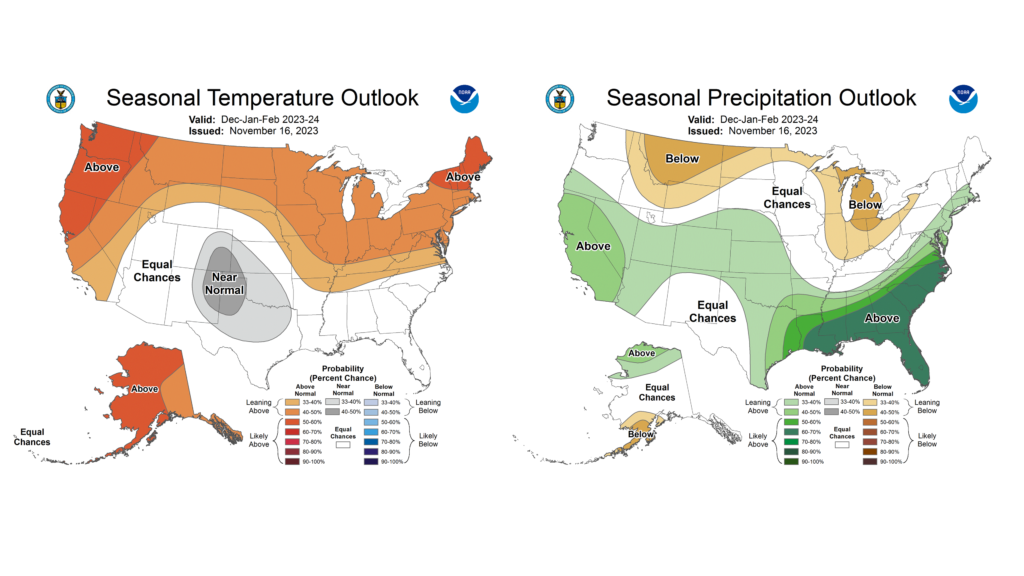
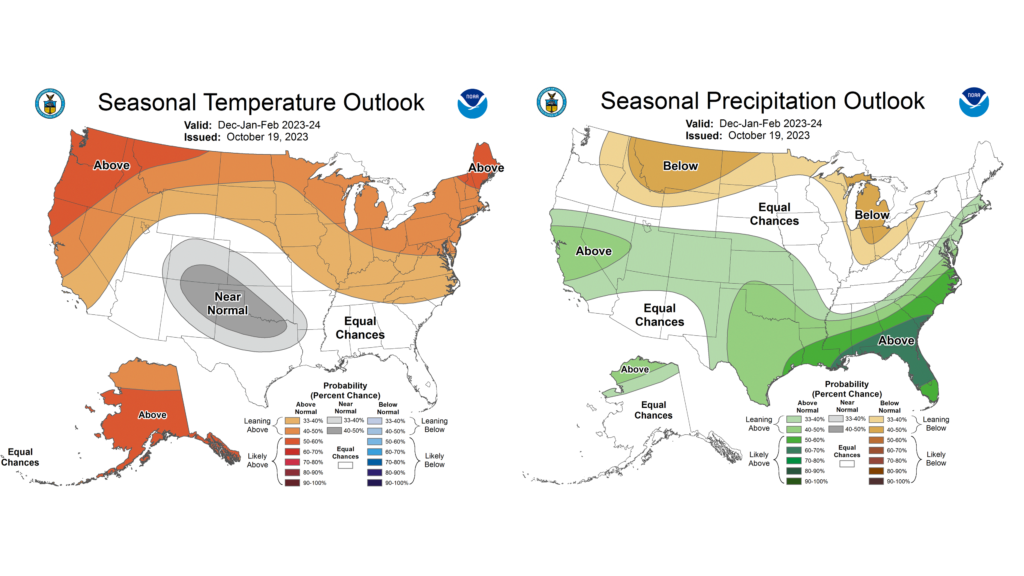
Meanwhile, NOAA leans even more heavily into El Niño for climatological winter (December–February) outlooks (Figure 7). The outlooks show highest chances of above normal temperatures in winter, with mostly equal chances of above or below normal precipitation.
Figure 7. Maps of (left) temperature and (right) precipitation outlooks for winter (December–February).