The preliminary statewide average October temperature was 59.7 degrees, 5.1 degrees above the 1991–2020 average and eighth warmest on record going back to 1895. The preliminary statewide average total October precipitation was 6.36 inches, 3.44 inches above the 1991–2020 average and the fourth wettest on record going back to 1895.
Data are provisional and may change slightly over time
Very Warm Start to October
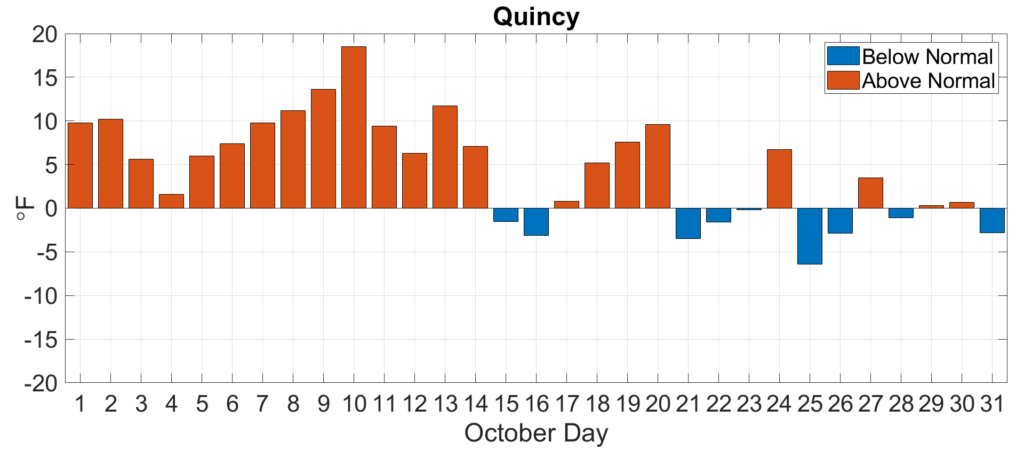
Following a warm start to fall in September, temperatures were consistently 5 to 10 degrees above normal for the first half of October. Figure 1 shows the daily temperature departure from normal in Quincy.
Figure 1. Daily August average temperature departures in Quincy.
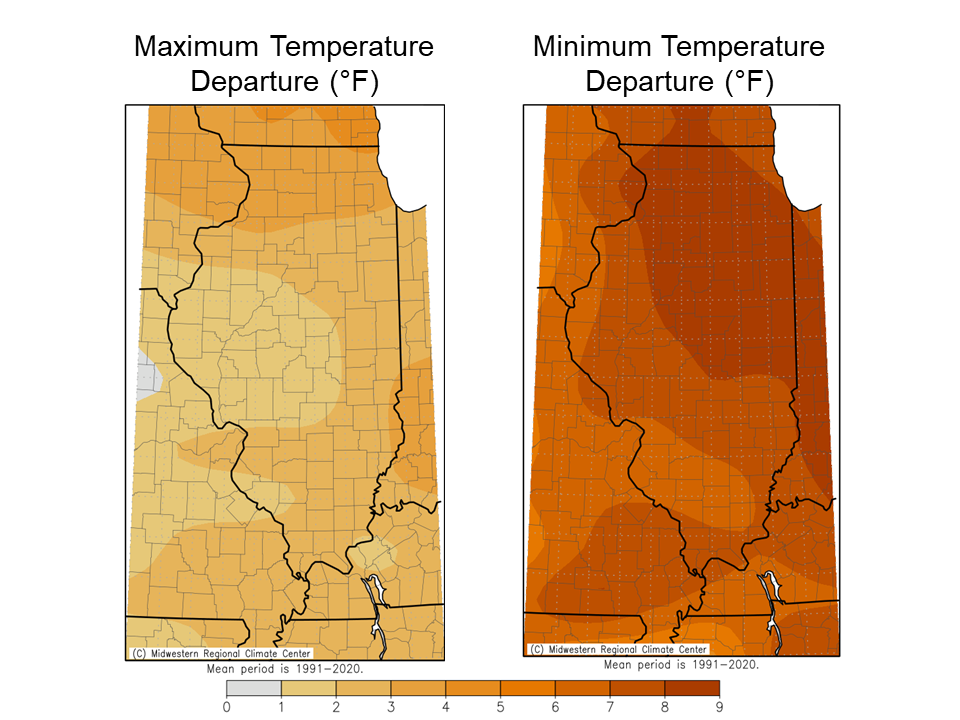
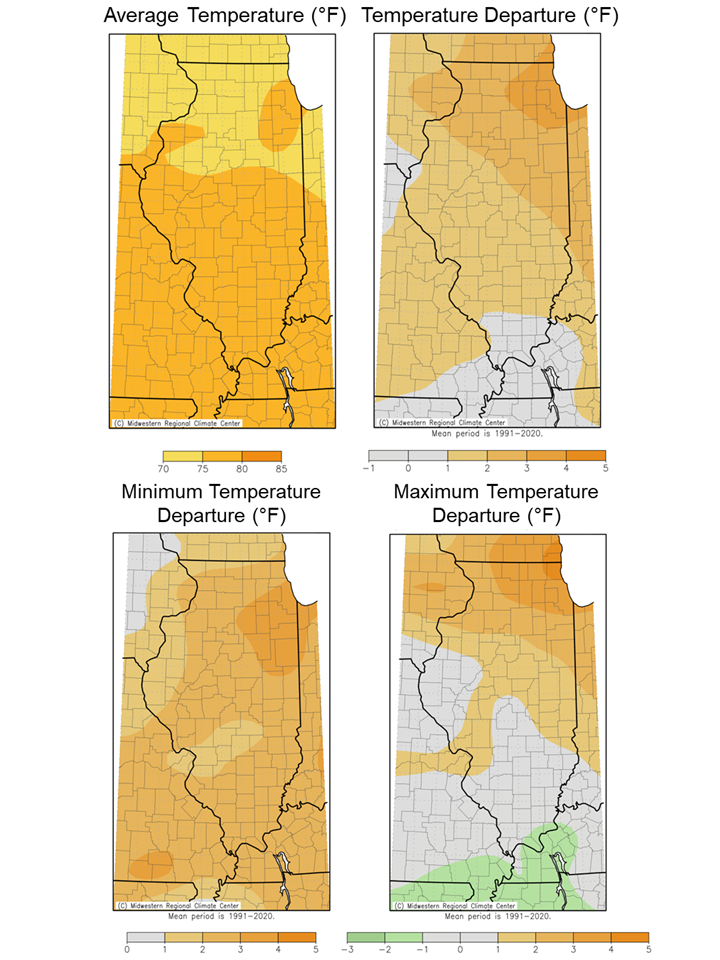
Figure 2 shows October average temperatures and average daily mean minimum and maximum temperature departures. Although daily average and daily maximum temperatures were both above normal in October statewide, nighttime minimum temperatures had the highest departures. October average daily minimum temperatures ranged from 5 to 9 degrees above average in Illinois. The average nighttime minimum temperature last month was the highest on record in Chicago, Peoria, and Paducah and the top five highest on record in Rockford, the Quad Cities, Quincy, and St. Louis.
Figure 2. Maps of (top) October average temperature and average temperature departures from normal and (bottom) October maximum and minimum temperature departures from normal.
The highest temperature observed in October was 91 degrees in Congerville in Woodford County, and the lowest temperature was 24 degrees in Galena in Jo Daviess County. The unusually warm weather in October broke 13 daily high maximum temperature records and 58 daily high minimum temperature records. No daily low maximum or low minimum temperature records were broken last month.
Overall, the preliminary statewide average October temperature was 59.7 degrees, 5.1 degrees above the 1991–2020 average and the eighth warmest on record going back to 1895.
Soggy October
Following a very dry September for most of northern Illinois, the taps opened in October and created persistently soggy conditions. For example, Champaign recorded 19 “wet days” in October, those in which at least 0.01 inches of precipitation are observed, which was the third most on record.
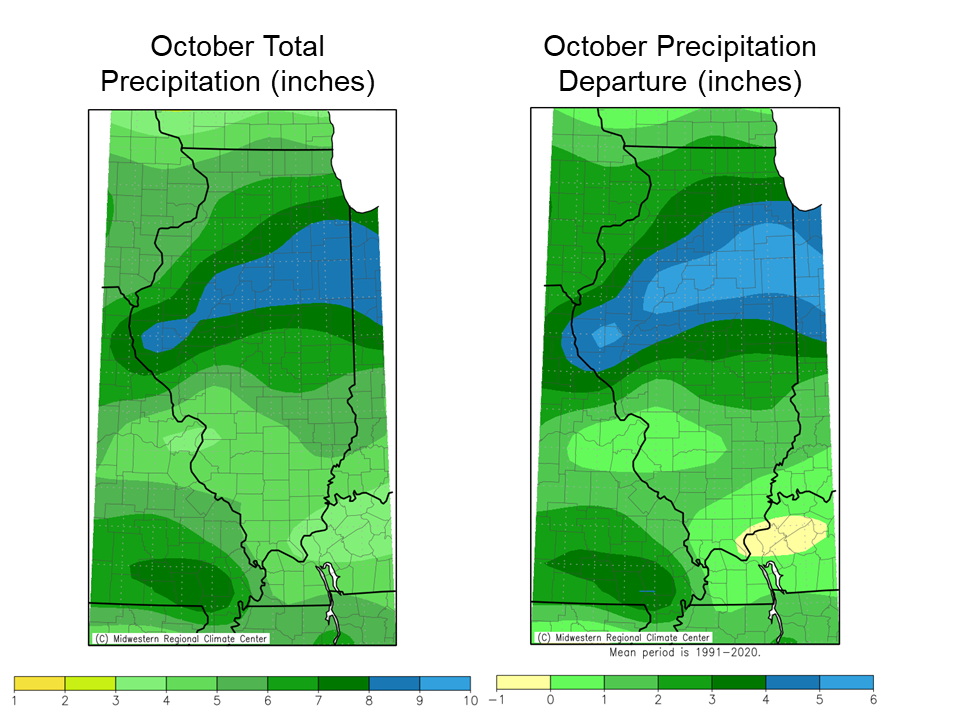
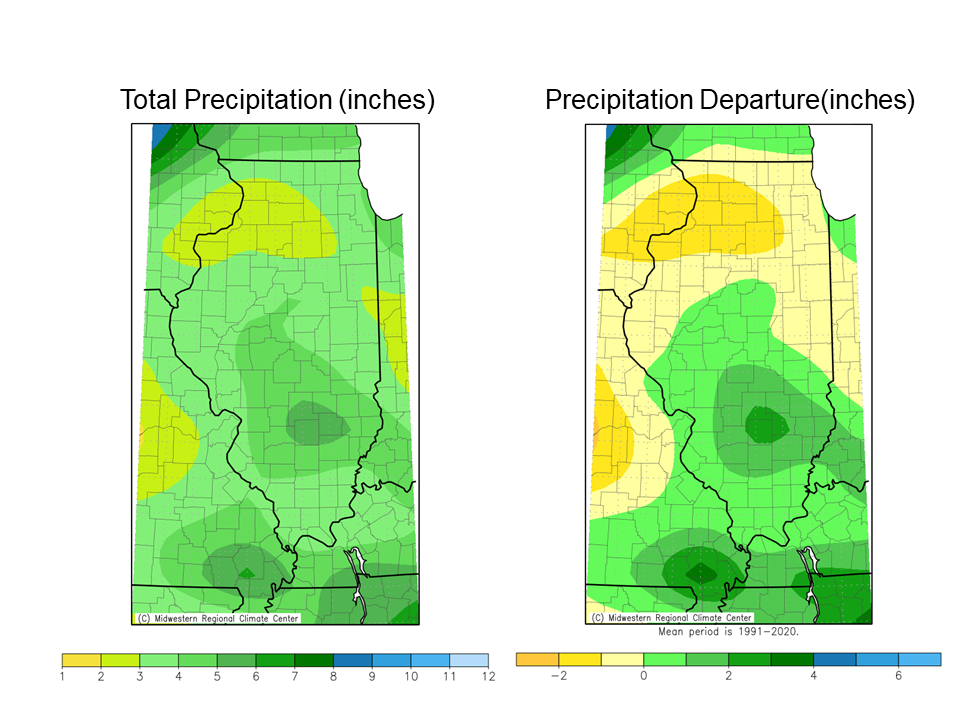
The persistently wet conditions resulted in monthly totals ranging from 3.5 inches in southwest and far southeast Illinois to over 9 inches in parts of north-central Illinois (Figure 3). While southern Illinois was between 1 and 3 inches wetter than normal last month, parts of central and northern Illinois were 3 to 6 inches wetter than normal. It was the second wettest October on record in Peoria and Quincy and the fifth wettest in Springfield.
Figure 3. Maps show (left) total October precipitation and (right) October precipitation departure from normal.
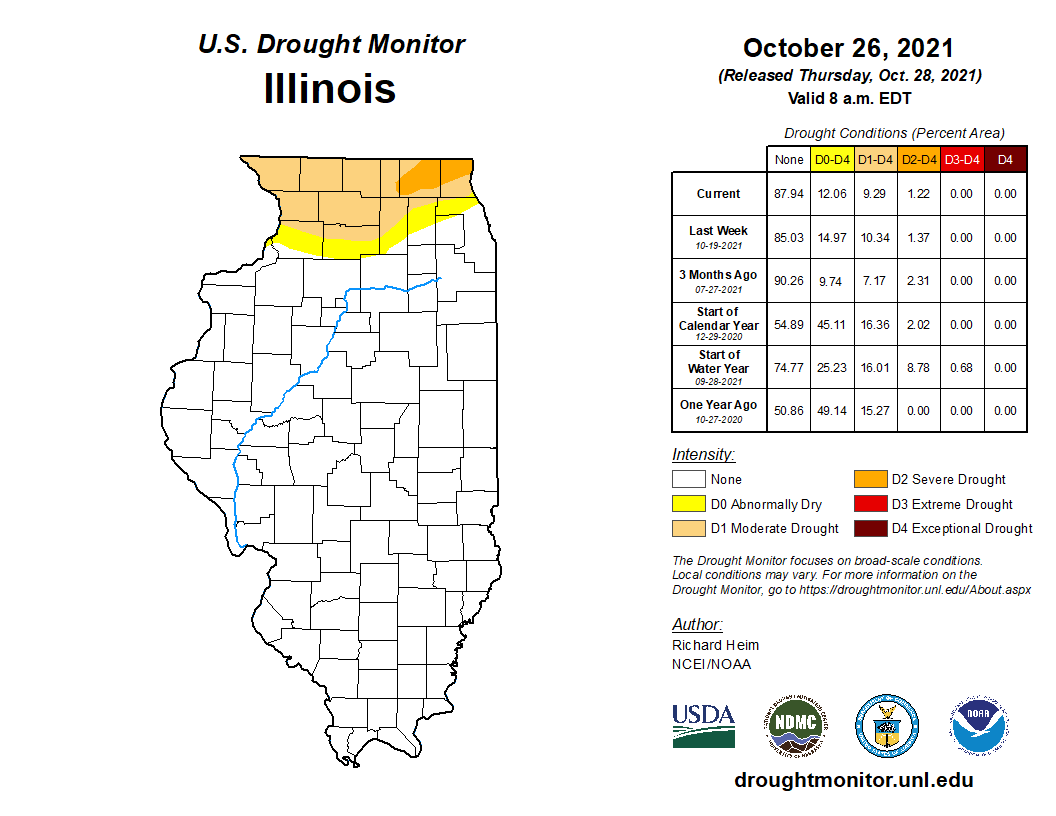
Although the rain put October harvest on hiatus, it was greatly beneficial to improving drought conditions in northern Illinois. Soil moisture and streamflow were both boosted by the wet conditions last month. The U.S. Drought Monitor showed improved drought conditions throughout much of northern Illinois in the most recent map (Figure 4). The percentage of the state in at least severe drought (D2) declined from 8.78 percent on October 1 to 1.22 percent in the most current map.
However, most areas between Whiteside County in northwest Illinois and Lake County in northeast Illinois remain in moderate to severe drought, as year-to-date precipitation deficits of 5 to 10 inches remain. Wetter weather will need to prevail throughout winter to terminate the northern Illinois drought, but October was a big step in the right direction.
Figure 4. U.S. Drought Monitor map current as of October 26.
Overall, the preliminary statewide average total October precipitation was 6.36 inches, 3.44 inches above the 1991–2020 average and the fourth wettest on record going back to 1895.
November and Winter Outlooks
The gap between the 30-year normal October average temperature and September average temperature is the largest of any two months statewide, at 11.5 degrees. This means that as we look ahead, irrespective of the outlook, temperatures will decrease as we move into November.
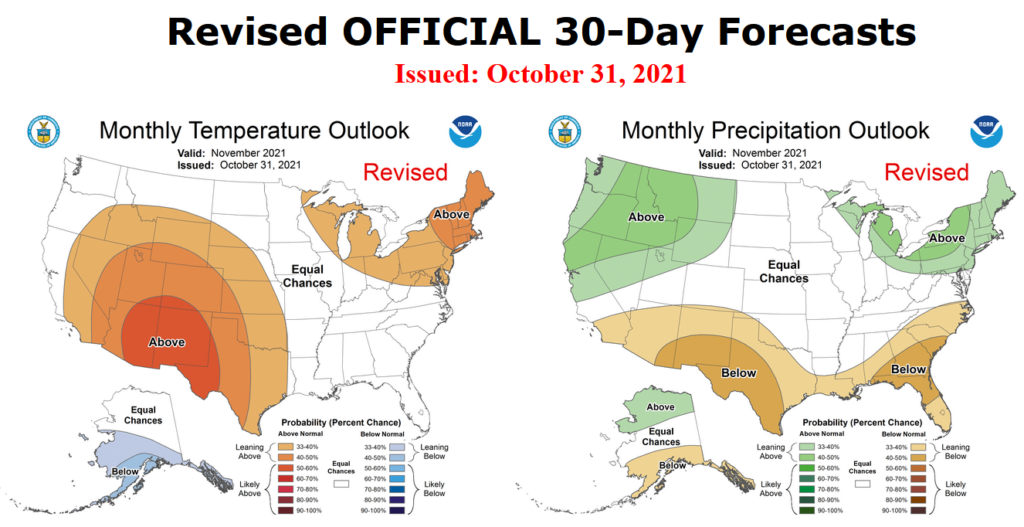
With that said, the most recent Climate Prediction Center outlooks for the whole month of November show equal chances of above and below normal temperatures and precipitation across the state (Figure 5).
Figure 5. Climate Prediction Center outlooks for the month of November. Temperature on the left and precipitation on the right.
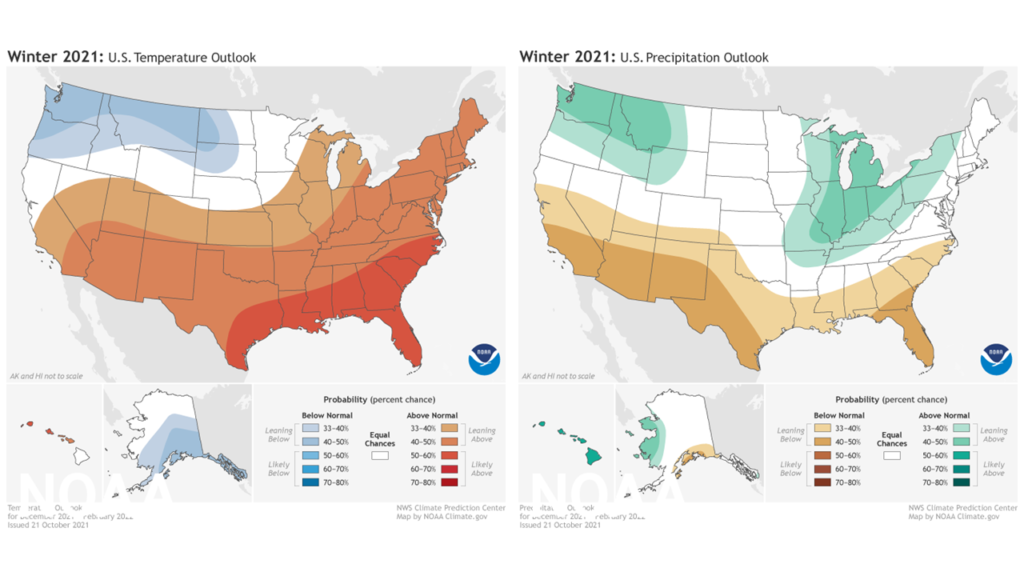
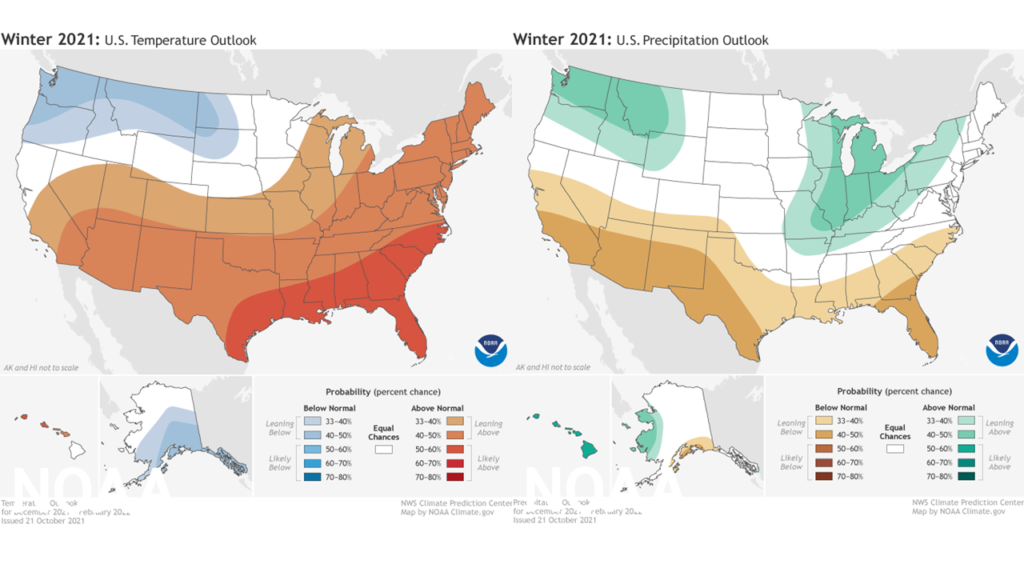
The end of October also brought the Climate Prediction Center’s sought-after climatological winter (December–February) outlooks. Following a typical La Niña pattern, the outlooks show the highest odds of a warmer and wetter than normal winter across the state (Figure 6).
Figure 6. Climate Prediction Center outlooks for winter (December – February). Temperature on the left and precipitation on the right.
Drought in northern Illinois this spring and summer caused impacts to agriculture, ecology, and water resources. However, reports from the region suggested the impacts from the ongoing 2021 drought in northern Illinois have not been as extreme as past severe drought events, such as those in 1988 and 2012. Here we provide a summary of the 2021 drought through October and compare weather, climate, and soil conditions from this drought to those in prior years.
Very Dry Spring
The 2021 drought followed an exceptionally wet period in northern Illinois. The 18-month period between December 2018 and May 2020 was the wettest on record in the northeast Illinois climate division, and 2020 was the third consecutive year in which the May total precipitation record was broken in Chicago.
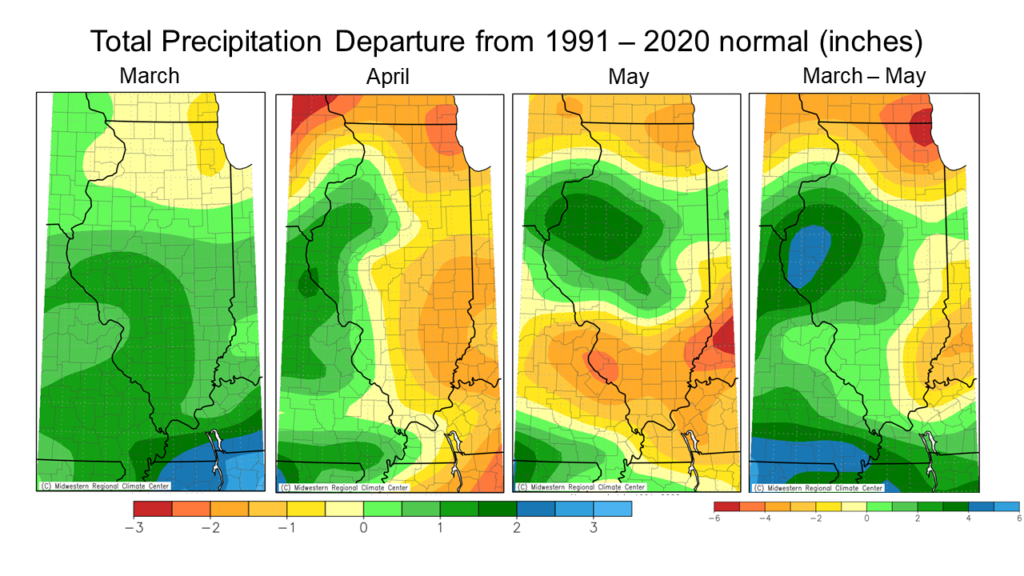
Following a cold and snowy end to winter, March 2021 was much milder by comparison and 1 to 2 inches drier than normal in northeast Illinois. The dry start to spring was followed by 1-to-2-inch precipitation deficits in April and May in northern Illinois, with the largest deficits in the central and northern Chicagoland area (Figure 1). Spring 2021 ended as the second driest in Lake County, fourth driest in McHenry County, and fifth driest in DuPage County. Spring 2021 was between 0.5 inches and 1.5 inches drier than in 2012 and 1988 in northeast Illinois.
Figure 1. Total precipitation in March, April, May, and spring 2021, expressed as a departure from the 1991-2020 normals.
Timely Summer Rain
The first half of June started warm and dry across the state. The average temperature in the first 20 days of June was the fifth highest on record in both the northeast and northwest Illinois climate divisions, and precipitation over the same time was the fourth lowest on record in both divisions. The drought in northeast Illinois began to spread west as most areas between Rockford and the Quad Cities began to show signs of drought.
A large atmospheric ridge established over the Pacific Northwest in late June, and most of Illinois found itself on the edge of a stationary front that produced several rounds of heavy rain across the state. Chicago received nearly 6 inches of rain in the last 10 days of June, almost twice what the city had received for the entire spring.
Following the wet end to June, July precipitation was hard to come by. Although July ended 1 to 2 inches drier than normal across northern Illinois, the month was also 1 to 2 degrees cooler than normal, which reduced the effects of evaporation and evaporative demand on crops and other vegetation. Meanwhile, high pressure over the north-central Atlantic Ocean kept moisture movement out of the Gulf of Mexico into the Midwest throughout the months of July and August. This persistent pattern caused unusually high humidity in northern Illinois despite very little soil moisture. In general, dry summers in Illinois tend to have lower humidity, but July and August average dewpoint temperatures, a common measure of humidity, were both above normal across northern Illinois this year.
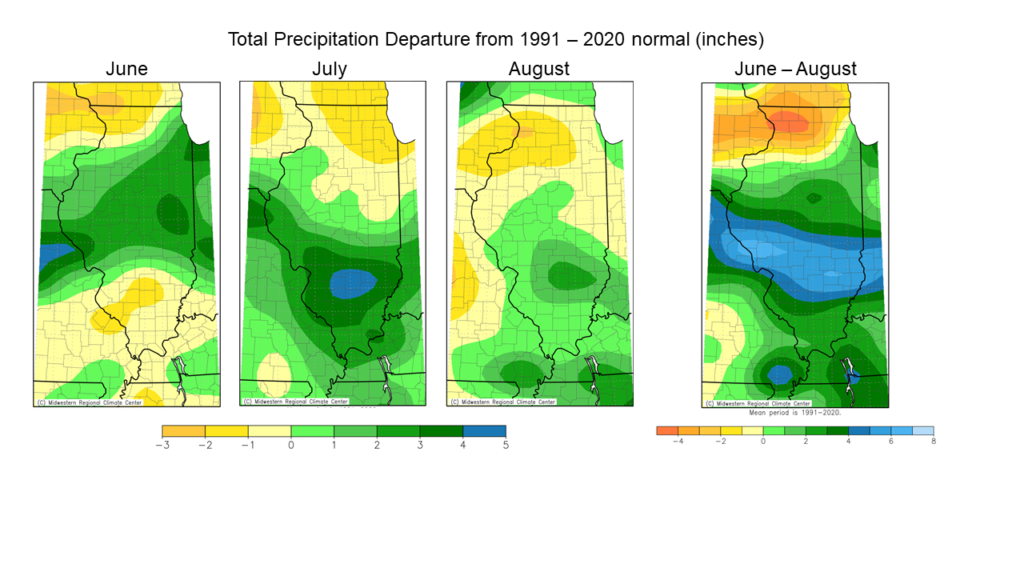
Several rounds of rain moved across northern Illinois in early August, bringing an additional relief to parched soils, crops, and ecosystems. The rain was especially timely for agriculture, giving corn and soybean crops much needed water during reproduction. The latter two-thirds of August was very dry across the region and vegetation stress set in again. The re-emergence of drought was especially noticeable in northwest Illinois, as most areas west of Rockford had received considerably less rain in early August than farther east. Overall, summer 2021 was 3 to 4 inches drier than normal in northwest Illinois, and near to slightly wetter than normal in parts of northeast Illinois (Figure 2).
Figure 2. Total precipitation in June, July, August, and summer 2021, expressed as a departure from the 1991-2020 normals.
It is still too early to fully account the impacts of the 2021 drought in northern Illinois, and indeed most of the region remains in drought as of late October. Reports and observations from the area suggest unirrigated corn and soybean crops and specialty crops, including apples, did suffer from moisture stress and likely caused some hit to yields. Likewise, the drought caused a myriad of ecological impacts, including young and mature trees prematurely dropping leaves, lawns going dormant early in the summer season, and less vigorous blooms in native flowering perennials.
Additionally, many residents in the region reported very low levels in area ponds, lakes, and rivers. The unusually dry spring and start to summer caused concerns about near-record low flow on the Fox River in northeast Illinois. Several municipalities in McHenry County were under mandatory watering restrictions throughout the summer, and most counties and municipalities strongly encouraged water conservation due to the dry conditions. With that said, the known impacts of the 2021 drought in northern Illinois are not as severe or extensive as those from droughts in 1988 and 2012. In the next section we explore meteorological differences between these droughts and discuss some of the unique characteristics of this year’s drought event that may have contributed to overall less severe impacts.
Differences and Similarities to 1988 and 2012
In essence, drought is defined as a period of below normal precipitation sufficient to cause impacts. However, the severity of drought impacts is not solely dependent on the magnitude of precipitation deficit, but is also affected by precipitation timing, evaporative demand, and human demand on water resources. Because of these complex interactions, each drought has a unique set of characteristics and impacts.
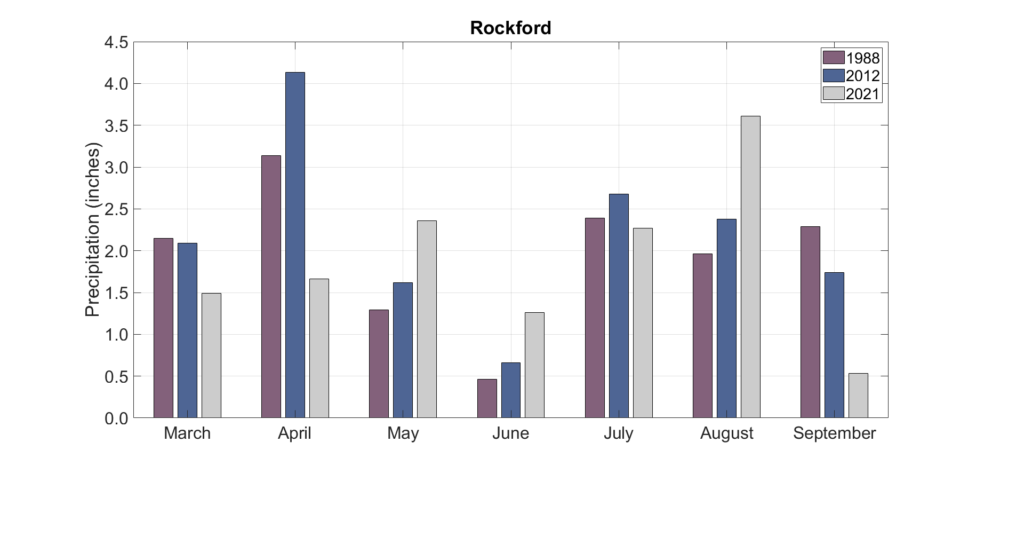
The 2021 growing season drought in northern Illinois was, by some measures, as severe as those in 2012 and 1988. For example, the six-month period from March to September in 2021 was the driest on record in Rockford, half an inch drier than the same period in 1988 and over 2 inches drier than in 2012. However, as Figure 3 shows, the timing of spring and summer precipitation in the Rockford area this year differed quite a bit from those previous drought years.
Figure 3. Monthly total precipitation at Rockford between March and September in the drought years of 1988, 2012, and 2021.
March and April were drier this year than in 1988 and 2012. Ironically, dry weather in March and April can help reduce ecological vulnerability to drought later in the growing season. For agriculture, relatively dry soils in spring facilitate strong root growth, which means that plants can reach deeper layer moisture in the soil if the top layer dries out. Additionally, some species of deciduous trees will produce smaller leaves in response to spring drought, which reduces water loss through transpiration later in the growing season.
Although June was climatologically drier than normal this year, the greatly beneficial late June rain in northern Illinois this year separated it from the extremely dry months of June in 1988 and 2012. July precipitation this year was nearly equal to that in 1988 and 2012, but August was 1 to 1.5 inches wetter this year than in both previous drought events. Precipitation in early August was crucial to preventing widespread drought damage to crops and ecosystems and potential impacts to water resources in the region akin to impacts that occurred in 1988 and 2012.
Although precipitation is the primary driver of drought, the amount of atmospheric demand for evaporation from soils and transpiration from plants, often called evaporative demand, also plays an important role in drought severity and persistence. Evaporative demand is largely driven by air temperature, humidity, radiation, and wind. Very high evaporative demand will exacerbate drought impacts to agriculture, water resources, and natural ecosystems. Along with evaporation from lakes and streams, drought in the growing season usually causes elevated human demand for watering drought-stressed lawns and trees. These factors together can tax water resources and quickly deplete lake and stream levels. In turn, low evaporative demand during drought, although rare, can help reduce drought impacts.
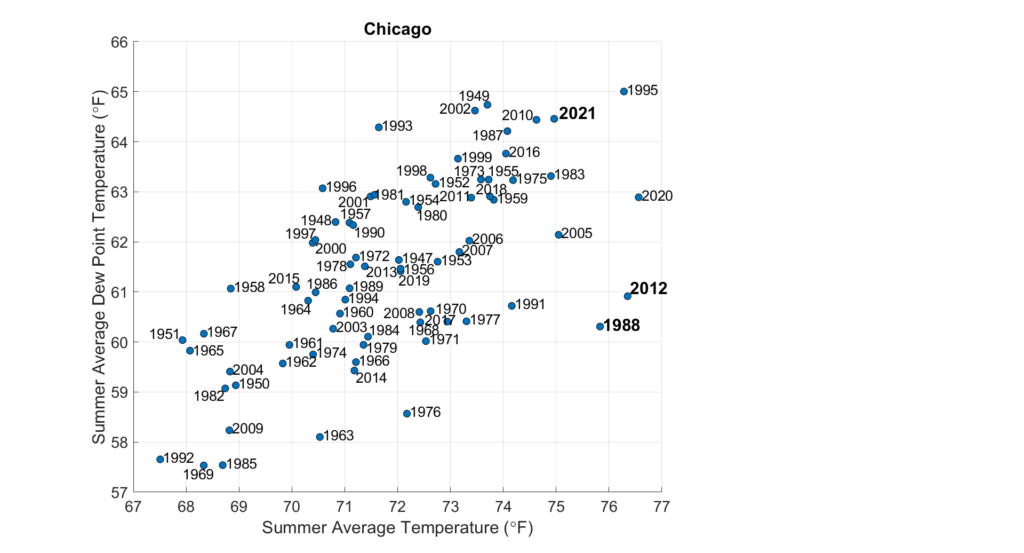
The spring and summer of 2021 were both warmer than normal across northern Illinois, but daily maximum temperatures were not nearly as high as in 1988 and 2012. For example, the summer average daily maximum temperature in Chicago in 2021 was 84.1 degrees, 3 degrees less than in 2012 and 1988. Meanwhile, summer humidity in 2021 was consistently higher than in the summers of 1988 and 2012. Despite similar average summer temperatures in Chicago in the three years, the average dew point temperature in 2021 was 3 to 4 degrees higher (i.e., higher humidity) than in 2012 and 1988 (Figure 4).
Figure 4. Summer average temperature (horizontal axis) versus the summer average dew point temperature (vertical axis) in Chicago.
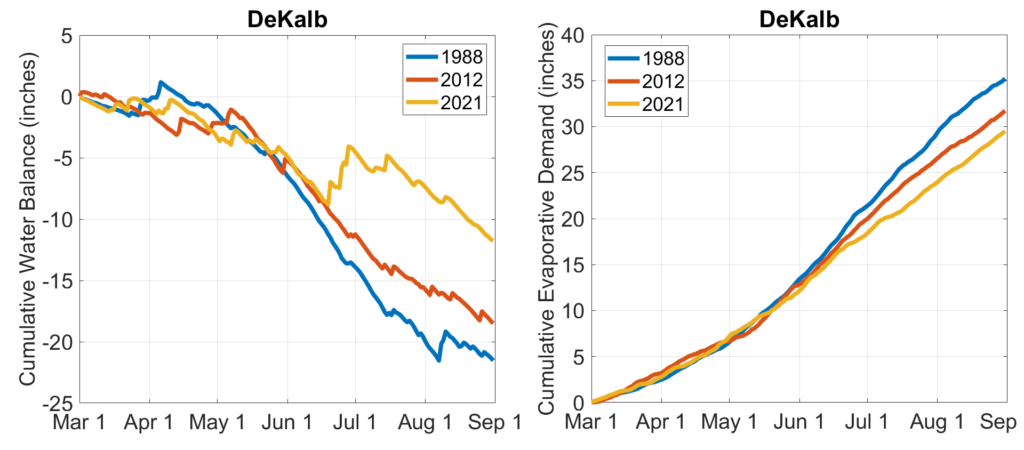
As Figure 5 shows using observations from the Illinois Climate Network station in DeKalb, the combination of lower temperatures and higher humidity in 2021 reduced evaporative demand relative to 1988 and 2012. Cumulative evaporative demand between March 1 and September 1 in DeKalb was 27 inches in 2021 compared to 32 inches in 2012 and 35 inches in 1988. When factoring in differences in precipitation between the years, the growing season water balance, the precipitation minus evaporative demand, in DeKalb in 2021 was 6 to 10 inches less than in 2012 and 1988. This difference in evaporative demand kept more moisture in the soil later into the growing season this year relative to prior droughts.
Figure 5. Plots show the evolution of the 1988 (blue), 2012 (red), and 2021 (yellow) droughts in DeKalb. The left panel shows the cumulative water balance (inches) from March 1 to September 1 in each year. Water balance is calculated as the daily difference between precipitation and evaporative demand. The right panel shows the cumulative daily evaporative demand from March 1 to September 1 in each year. Potential evapotranspiration is used to represent evaporative demand.
From a weather and climate perspective, the biggest difference between this year’s drought in northern Illinois and the droughts of record in 1988 and 2012 boil down to (1) small but beneficial rains in late June and early August this year that did not occur in the previous two droughts and (2) substantially lower evaporative demand this year due to lower maximum air temperature and higher humidity.
When Will the Drought End?
Northern Illinois saw more rain in the first three weeks of October than in the months of May, June, and September put together. Although a bit too late for agriculture, lawns, and perennials, the rain went a long way to improve soil moisture and streamflow conditions.
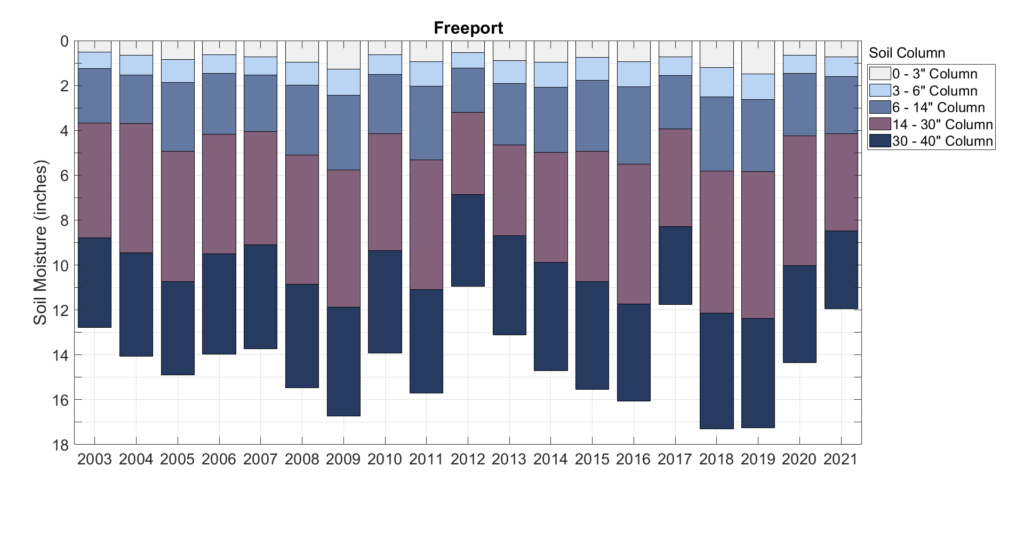
Figure 6 shows the total amount of moisture in the top 40-inch soil column at the Illinois Climate Network station in Freeport. As of October 25, the top 40-inch soil column had approximately 12 inches of water, compared to over 14 inches in 2020 and 17 inches in both 2019 and 2018. Although soils are still much drier than in past years at Freeport, they have 1 to 1.5 inches of additional water in the top 40-inch column than in mid-October in 2012.
Figure 6. Mid-October soil moisture (inches) in the top 40-inch soil column at Freeport.
So, the region has improved considerably over the past 3 to 4 weeks, and soil moisture and streamflow are in better shape than this time in 2012. However, much of northern Illinois remains in an 8-to-10-inch precipitation deficit going back to the start of the year. Winter can be an important season for drought recovery, despite winter months being among the climatologically driest in Illinois. Recent research has shown about a quarter of droughts in Illinois end in winter, thanks in part to very low atmospheric and vegetation demand for water.
Soil moisture recharge in winter depends on the amount of winter precipitation, but also precipitation type and whether that precipitation falls on frozen soils. Precipitation ahead of soil frost development this winter will be beneficial to continuing moisture recharge across northern Illinois. Recharge efficiency of winter rain declines sharply once the topsoil freezes. Meanwhile, abundant snow and below freezing temperatures in mid- to late winter can help prolong healthy snowpack and facilitate gradual snow melt and soil moisture recharge into spring.
The National Oceanic and Atmospheric Administration (NOAA) recently released its 2021–22 winter forecast, which covers December 2021 through February 2022 (https://www.noaa.gov/news-release/us-winter-outlook-drier-warmer-south-wetter-north-with-return-of-la-nina). The outlooks show elevated odds of warmer and wetter than normal conditions across the state (Figure 7). A wetter winter does not necessarily mean above average snowfall, and warmer winters tend to limit persistent snowpack. However, wet conditions through early winter along with a delay to soil frost would help continue the drought recovery we have seen in northern Illinois in October.
The preliminary statewide average September temperature was 69.4 degrees, 2.6 degrees above the 1991–2020 average, and tied for the 21st warmest on record going back to 1895. The preliminary statewide average total September precipitation was 2.38 inches, 0.97 inches below the 1991–2020 average and tied for the 36th driest on record going back to 1895.
Data are provisional and may change slightly over time
September was hot, but less humid
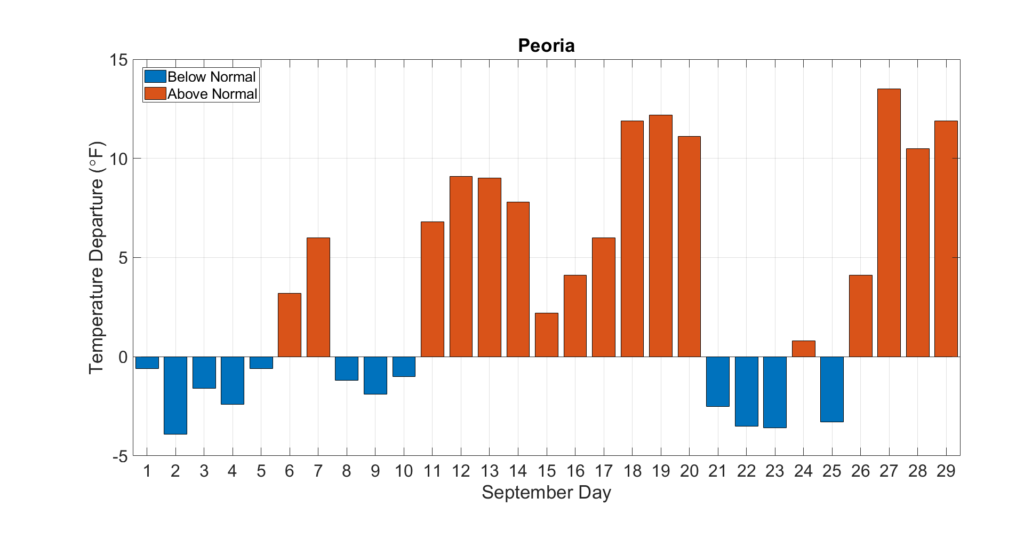
The cooldown that started the month of September gave us a taste of fall, but it was fleeting. Most of September passed with above normal temperatures across the state, and as Figure 1 shows from Peoria, temperatures on the hottest days were 5 to 15 degrees above normal.
Figure 1. Daily September average temperature departures at Peoria.
Warmer weather in September broke 15high daily maximum temperature records and 4high daily minimum temperature records across the state, including a record-breaking 77-degree minimum temperature in Alton on September 19. In contrast, only two low daily maximum temperature records and two low daily minimum temperature records were broken last month. The highest maximum temperature recorded last month was 94 degrees in Alton, while the lowest minimum temperature recorded last month was 36 degrees in Galena.
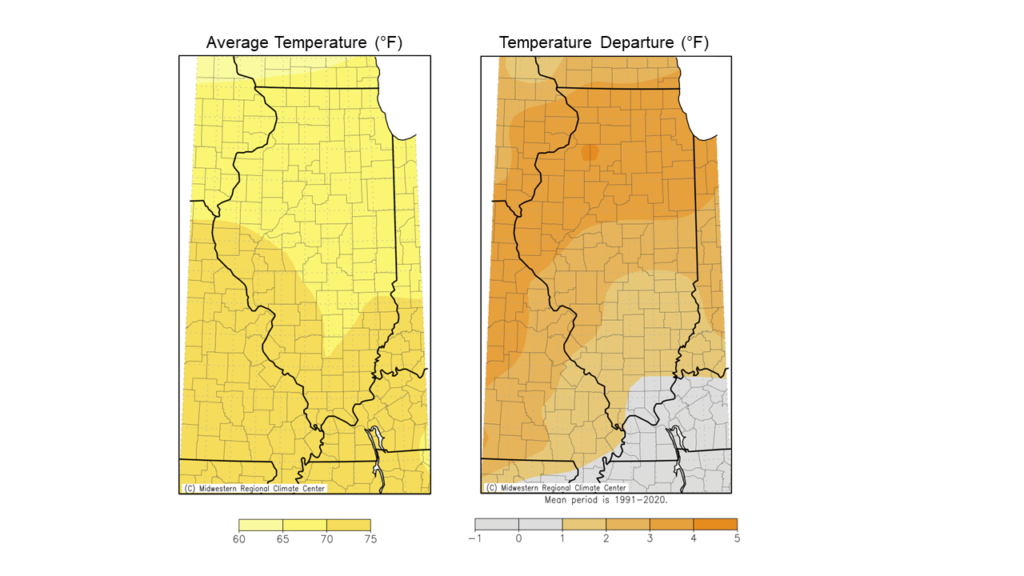
Overall, the September average temperature ranged from the mid- to high 60s in northern and north-central Illinois to the low 70s in southern Illinois. Last month was 3 to 5 degrees warmer than normal in northern Illinois and within 1 degree of normal in southern Illinois (Figure 2).
Figure 2. Maps of (left) average September temperature and (right) September temperature departures from normal.
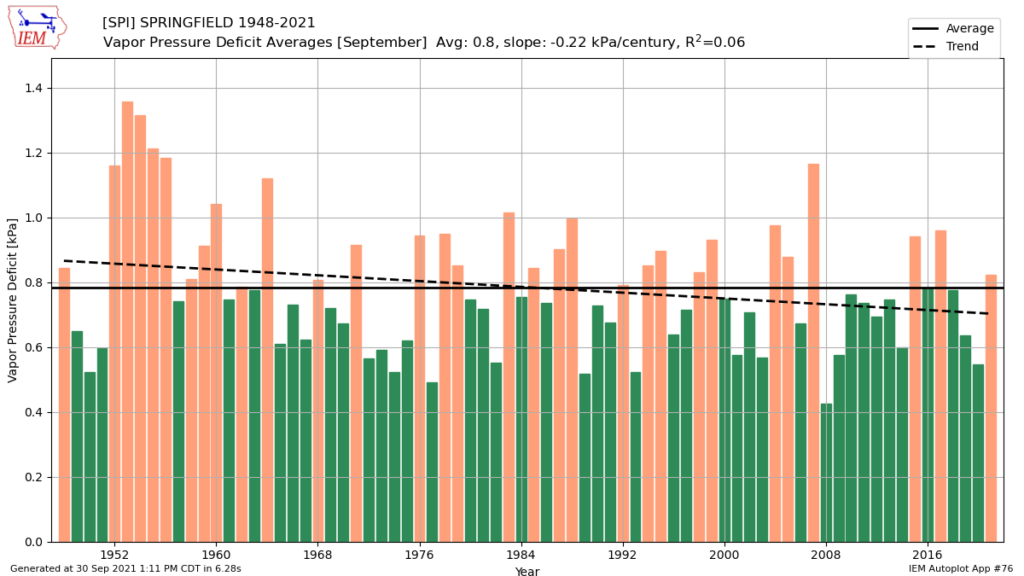
Despite the higher temperatures last month, the unusually high humidity across the state in July and August disappeared in September. Figure 3 shows the September average vapor pressure deficit, a representation of humidity, in Springfield. The above average vapor pressure deficit last month illustrates less humid conditions compared to Septembers in 2018, 2019, and 2020.
Figure 3. September average vapor pressure deficit in Springfield between 1948 and 2021.
Overall, the preliminary statewide average September temperature was 69.4 degrees, 2.6 degrees above the 1991–2020 average and tied for the 21st warmest on record going back to 1895.
Split Precipitation Pattern… Again
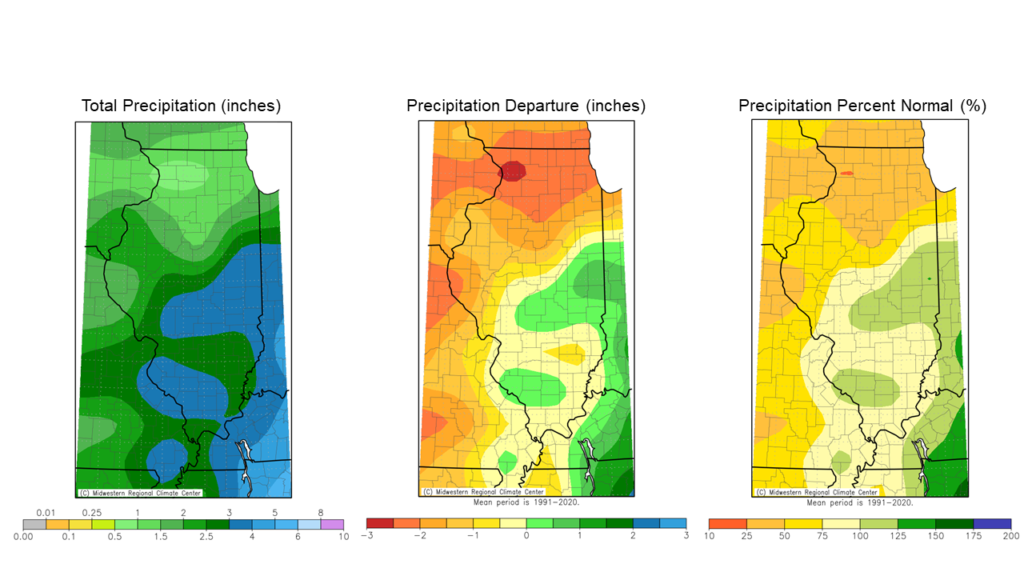
southern and central Illinois and dry in northern Illinois. September’s precipitation totals followed suit. Last month’s precipitation totals ranged from less than an inch northwest Illinois to over 5 inches in east-central and southern Illinois. September was 2 to 3 inches drier than normal throughout northern Illinois and near normal to about 1 inch wetter than normal in central and southern Illinois (Figure 4).
September was one of the drier months of the warm season, so despite only 0.53 inches of rain recorded last month, it was still only the seventh driest September on record in Rockford. However, dry conditions last month added to very dry spring and summer seasons in northern Illinois. The 2020-2021 water year, which runs from October 1 to September 30, was the third driest on record in Rockford. Total water year precipitation in Rockford was 21.69 inches, approximately 60 percent of average and 4 inches less than the 2011-2012 water year.
Overall, the preliminary statewide average total September precipitation was 2.38 inches, 0.97 inches below the 1991–2020 average and tied for 36th driest on record going back to 1895.
Figure 4. Maps of (left) total September precipitation, (middle) precipitation departure from normal, and (right) precipitation percent of normal.
Northern Illinois Drought
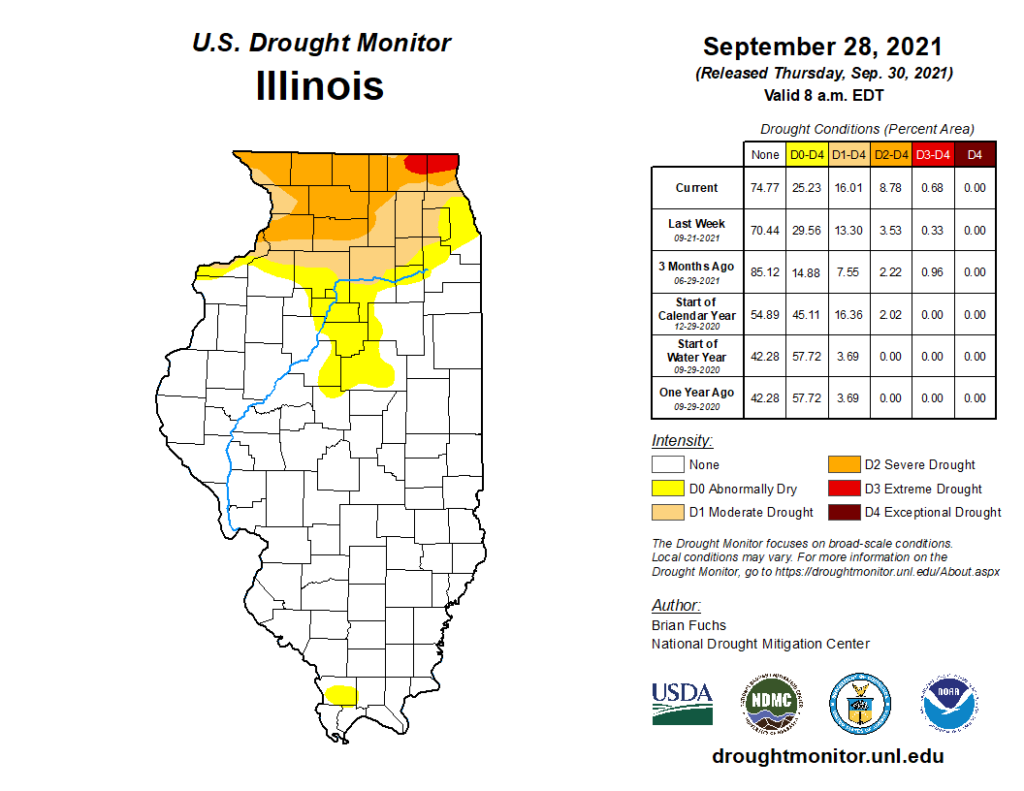
Very dry conditions last month added to existing precipitation deficits in northern Illinois. In response, the latest U.S. Drought Monitor expanded severe and moderate drought across the northern third of the state and expanded extreme drought in McHenry County (Figure 5). The percentage of the state in severe drought (8.78%) is the highest since fall of 2013.
Agricultural and ecological impacts have mostly run their course by this time of the year. However, the dry conditions have left substantial soil moisture deficits across northern Illinois, and a near to wetter than normal winter will be necessary to recharge dry soils. A healthy, persistent snowpack across northern Illinois would also go a long way to help improve soil moisture conditions as we move into next spring.
Figure 5. The U.S. Drought Monitor as of September 28th.
Outlooks
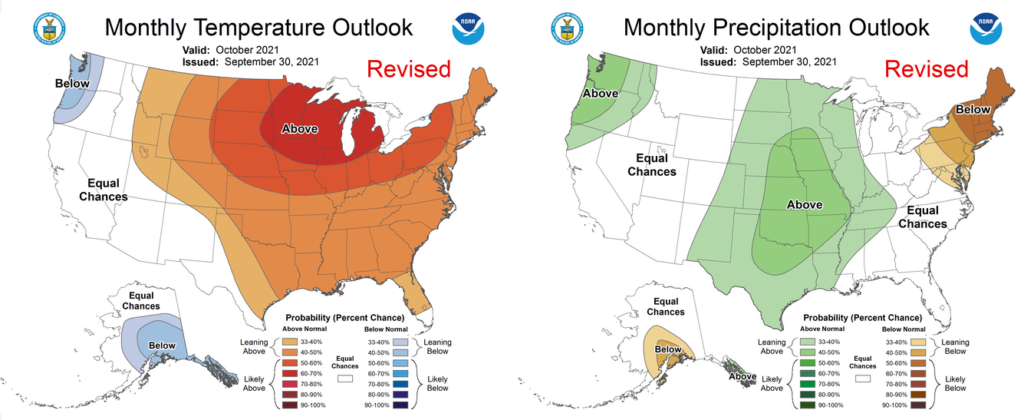
The gap between the 30-year normal September average temperature and October average temperature is the largest of any two months statewide, at 11.5 degrees. This means that as we look ahead, irrespective of the outlook, temperatures will decrease as we move into October.
With that said, the most recent Climate Prediction Center outlooks for the entire month of October show strongly elevated odds of above normal temperatures sticking around, though with slightly higher odds of wetter than normal conditions for the month as a whole (Figure 6).
Figure 6. Climate Prediction Center temperature (left) and precipitation (right) outlooks for the month of October.
The preliminary statewide average August temperature was 75.6 degrees, 2 degrees above the 1991–2020 average and tied for the 20th warmest on record going back to 1895. The preliminary statewide average total August precipitation was 3.76 inches, 0.20 inches above the 1991–2020 average and the 50th wettest on record going back to 1895.
Data are provisional and may change slightly over time
August Heat & Humidity
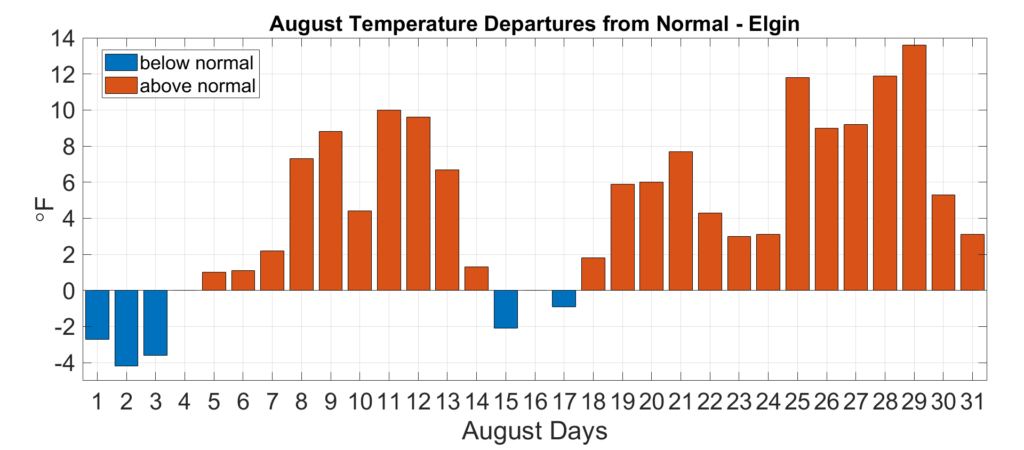
Apart from the first few days of the month, August temperatures were largely above normal across Illinois. As Figure 1 shows, all but 5 days in August had above normal temperatures in Elgin, and several days in the last week of August exhibited temperatures that were 10 to 15 degrees above normal.
Figure 1. Daily August average temperature departures in Elgin.
Overall, the August average temperature ranged from the low 70s in northern and north-central Illinois to the high 70s in southern Illinois. Last month was 2 to 4 degrees warmer than normal in northern Illinois and within 1 degree of normal in southern Illinois. However, as the maps in the bottom panel of Figure 2 show, daily August minimum temperatures had larger deviations from normal than daily maximum temperatures. In fact, in far southeast Illinois August minimum temperatures were 2 to 3 degrees above normal, while maximum temperatures were 1 to 2 degrees below normal.
Figure 2. Maps of (top left) average August temperature, (top right) August temperature departures from normal, (bottom left) August minimum temperature departures from normal, and (bottom right) August maximum temperature departures from normal.
Unusually high nighttime low temperatures last month were partly caused by persistently high humidity. One useful measure of humidity is the dewpoint temperature, which is the air temperature at which the air is saturated. Higher dewpoint temperatures indicate higher humidity, and humans begin to feel uncomfortable as dewpoints exceed 65 degrees.
The figure below shows the hourly frequency of dewpoint temperature observations exceeding 65 degrees at Champaign last month. Frequencies from last month (orange bars) are compared with average frequencies over the past 40 years (blue bars). August dewpoint temperatures exceeded 65 degrees more frequently than usual in each of the 24 hours of the day in Champaign, but the largest anomalies were in the early morning between 1 and 5 a.m. For example, well over half of the 3 a.m. dewpoints exceeded 65 degrees in Champaign last month, compared to around 30 percent of days on average. August in Champaign had the 2nd highest frequency of 3 a.m. dewpoint temperature observations.
Figure 3. Bar plot of frequency of August hourly dewpoint temperatures in Champaign this year (orange bars) compared to the 40-year average (blue bars).
Overall, the preliminary statewide average August temperature was 75.6 degrees, 2 degrees above the 1991–2020 average and tied for 20th warmest on record going back to 1895.
Climatological Summer Temperatures
August brings a wrap-up of climatological summer. Summer average temperatures ranged from the high 60s in southern Illinois to the mid- to high 70s in southern Illinois. This summer was 1 to 3 degrees warmer than average in the northern one-third of the state, and within 1 degree of normal south of Interstate 74. Similar to August, we saw large differences between minimum and maximum temperature departures. Summer minimum temperatures were 1 to 4 degrees above normal statewide, while summer maximum temperatures were more than 1 degree above normal only north of Interstate 80.
Figure 4. Maps of (top left) average summer temperature, (top right) summer temperature departures from normal, (bottom left) summer minimum temperature departures from normal, and (bottom right) summer maximum temperature departures from normal.
Wet, Active Weather in Northern Illinois
August precipitation totals ranged from less than an inch in parts of northwest and western Illinois to over 11 inches in north-central Illinois. Last month was 1 to 3 inches drier than normal throughout most of the northern two-thirds of the state and was between 1 and 5 inches wetter than normal in southern Illinois.
Figure 5. Maps of (left) total August precipitation and (right) precipitation departure from normal.
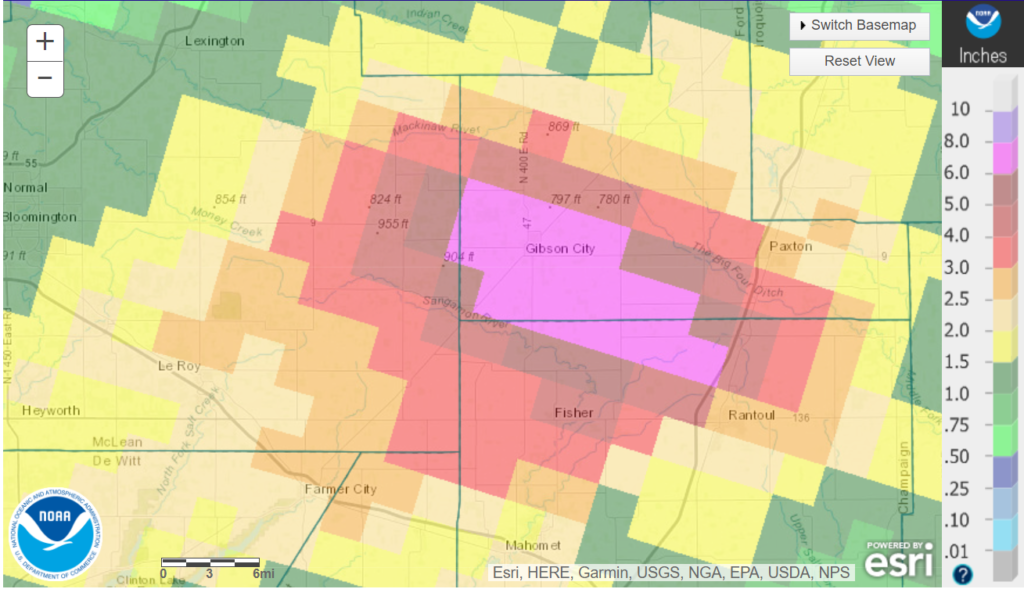
Because of the heat and humidity, August precipitation was accompanied by frequent severe weather events including several tornadoes, hail, and strong winds. Seven confirmed tornadoes touched down in northern Illinois on August 9 alone, including three EF-1 tornadoes. The five National Weather Service offices serving Illinois issued a combined 18 tornado warnings last month, the second most for August on record going back to 1986. Additionally, there were 93 severe thunderstorm warnings issued in Illinois last month, tied for the fourth most on record for August.
On August 12, a series of thunderstorms moved over the same area of north-central Illinois for hours, a phenomenon called training. The storms produced 4 to 5 inches of rain in just 6 hours across parts of McLean, Champaign, and Ford Counties in central Illinois. The epicenter of the heavy rainfall was Gibson City in Ford County, which received 10 to 12 inches in less than 6 hours on August 12. Consequently, Gibson City suffered from destructive urban flooding that displaced residents and flooded roads and buildings.
Figure 6. 24-hour precipitation totals from thunderstorms on August 12th across north-central Illinois.
Overall, the preliminary statewide average total August precipitation was 3.76 inches, 0.20 inches above the 1991–2020 average and the 50th wettest on record going back to 1895.
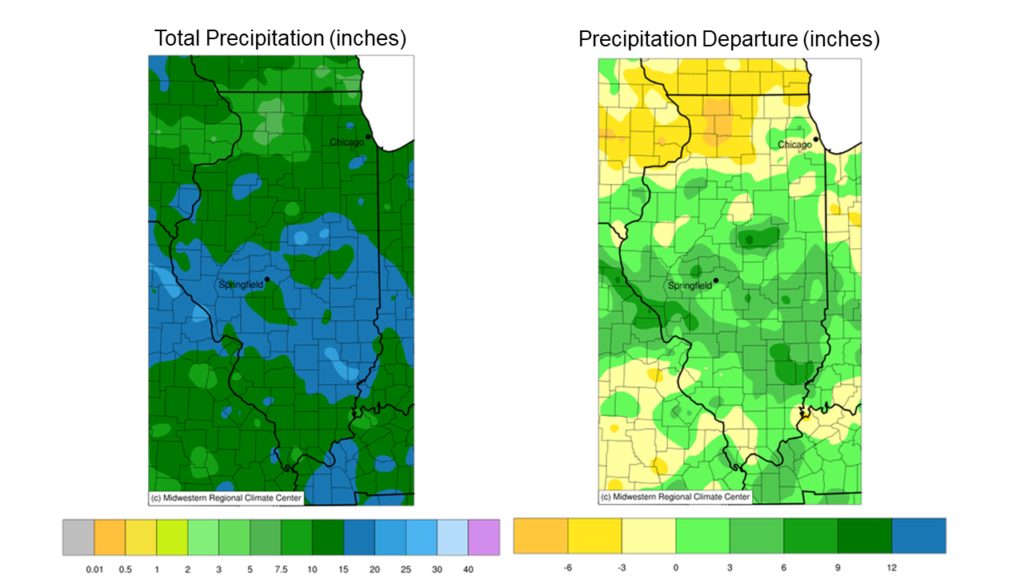
August ended a mostly wetter than normal summer for Illinois. Total summer precipitation ranged from around 5 inches in northwest Illinois to over 25 inches in parts of southeast and central Illinois. Most of the northwest corner of the state was 3 to 5 inches drier than normal this summer, while parts of central and south-central Illinois were 9 to 12 inches wetter than normal.
Figure 7. Maps of (left) summer total precipitation and (right) precipitation departure from normal.
Outlooks
The fall season has begun with cooler and less humid weather across Illinois, much to the relief of us all. As crops continue to mature and we inch toward sweaters and pumpkin-flavored drinks, we look to what the season has in store.
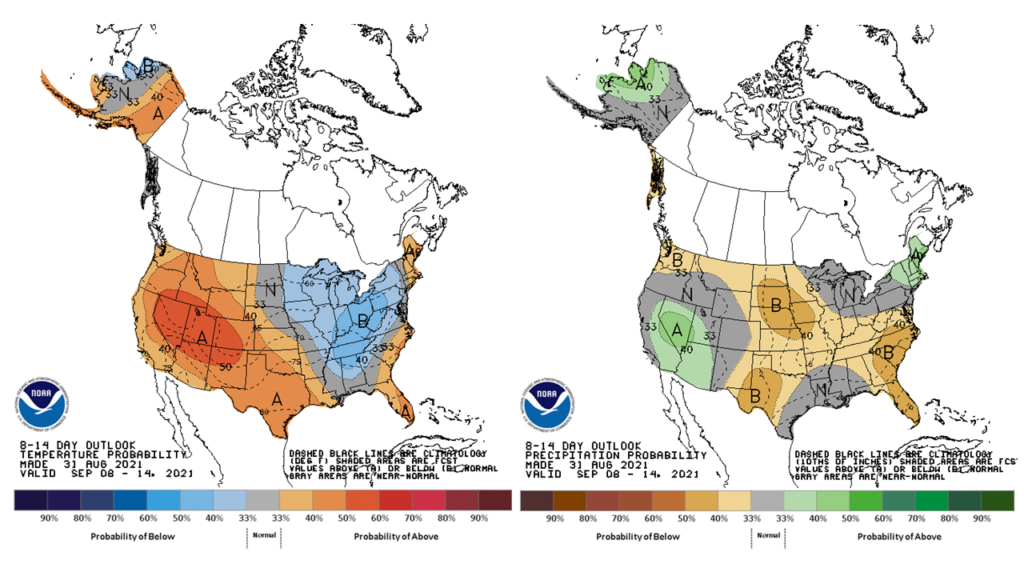
Climate Prediction Center outlooks for the second week of September show strongly elevated odds of below normal temperatures sticking around, with slightly elevated chances of below normal precipitation statewide.
Figure 8. Climate Prediction Center outlooks for the second week of September. Temperature on the left and precipitation on the right.
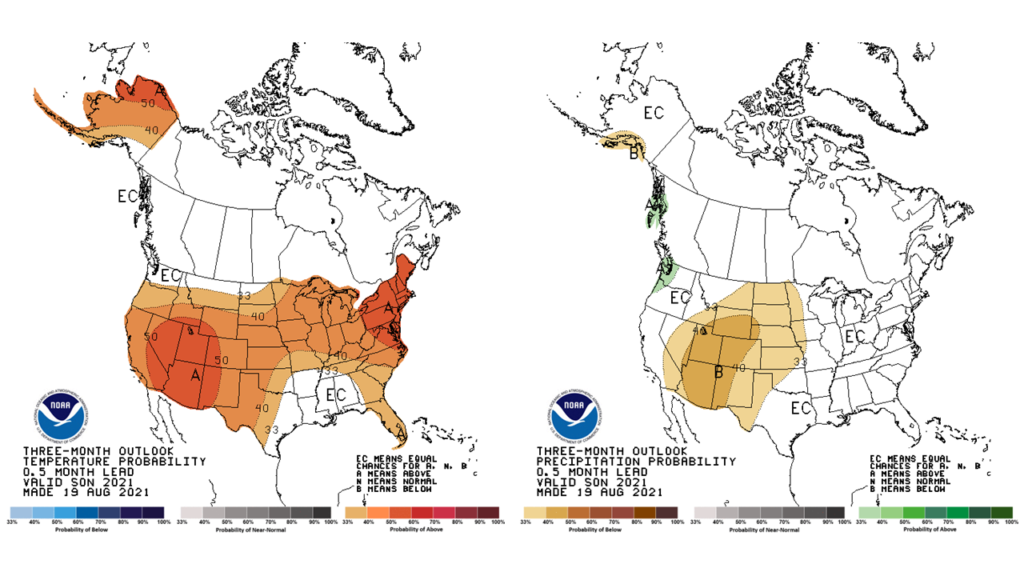
Although outlooks for the entire month of September do not show any expectations as to wetter, drier, hotter, or colder than normal, the 3-month outlooks for September through November lean toward warmer than average conditions across the Midwest.
Figure 9. Climate Prediction Center outlooks for the second week of September. Temperature on the left and precipitation on the right.