As we approach the end of climatological summer, I have received several questions regarding the fall, harvest, and potential of an early freeze. In this post I try to address some of those concerns based on recent outlooks and both long-term and recent historical data.
Fall Outlooks
The most recent 3-month outlook from the Climate Prediction Center (CPC) was released on July 16 and covers August through October. Those outlooks show elevated odds of above normal temperatures over these three months, with equal chances of above normal, normal, and below normal precipitation (see maps below).
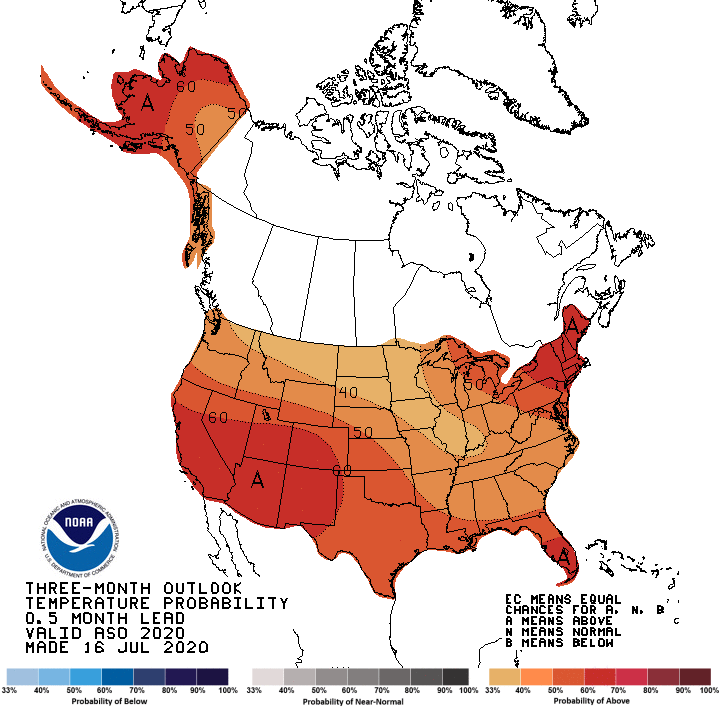
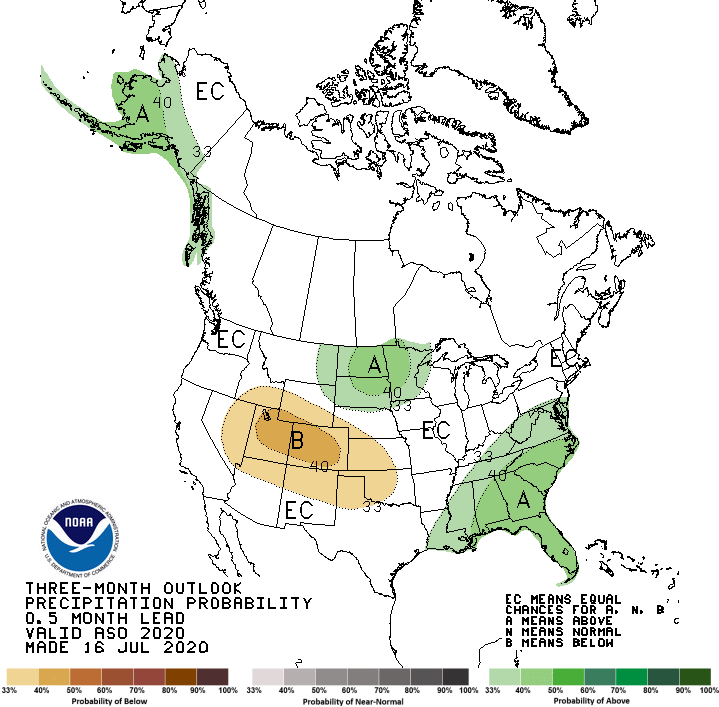
Much of the temperature outlook is based on the persistence of warmer than average weather from this summer, as well as sea surface temperatures and corresponding atmospheric conditions in the tropical and extratropical Pacific and Atlantic Oceans. However, another important contribution to these outlooks is from decadal trends in fall temperatures.
Fall Temperature Changes
Statewide, average temperature in climatological fall (September to November) has increased at a rate of 0.08 degrees (Fahrenheit) per decade between 1895 and 2019. However, fall warming has accelerated in recent decades. Over the past 30 years, the statewide average rate of fall temperature changes is 0.6 degrees per decade.
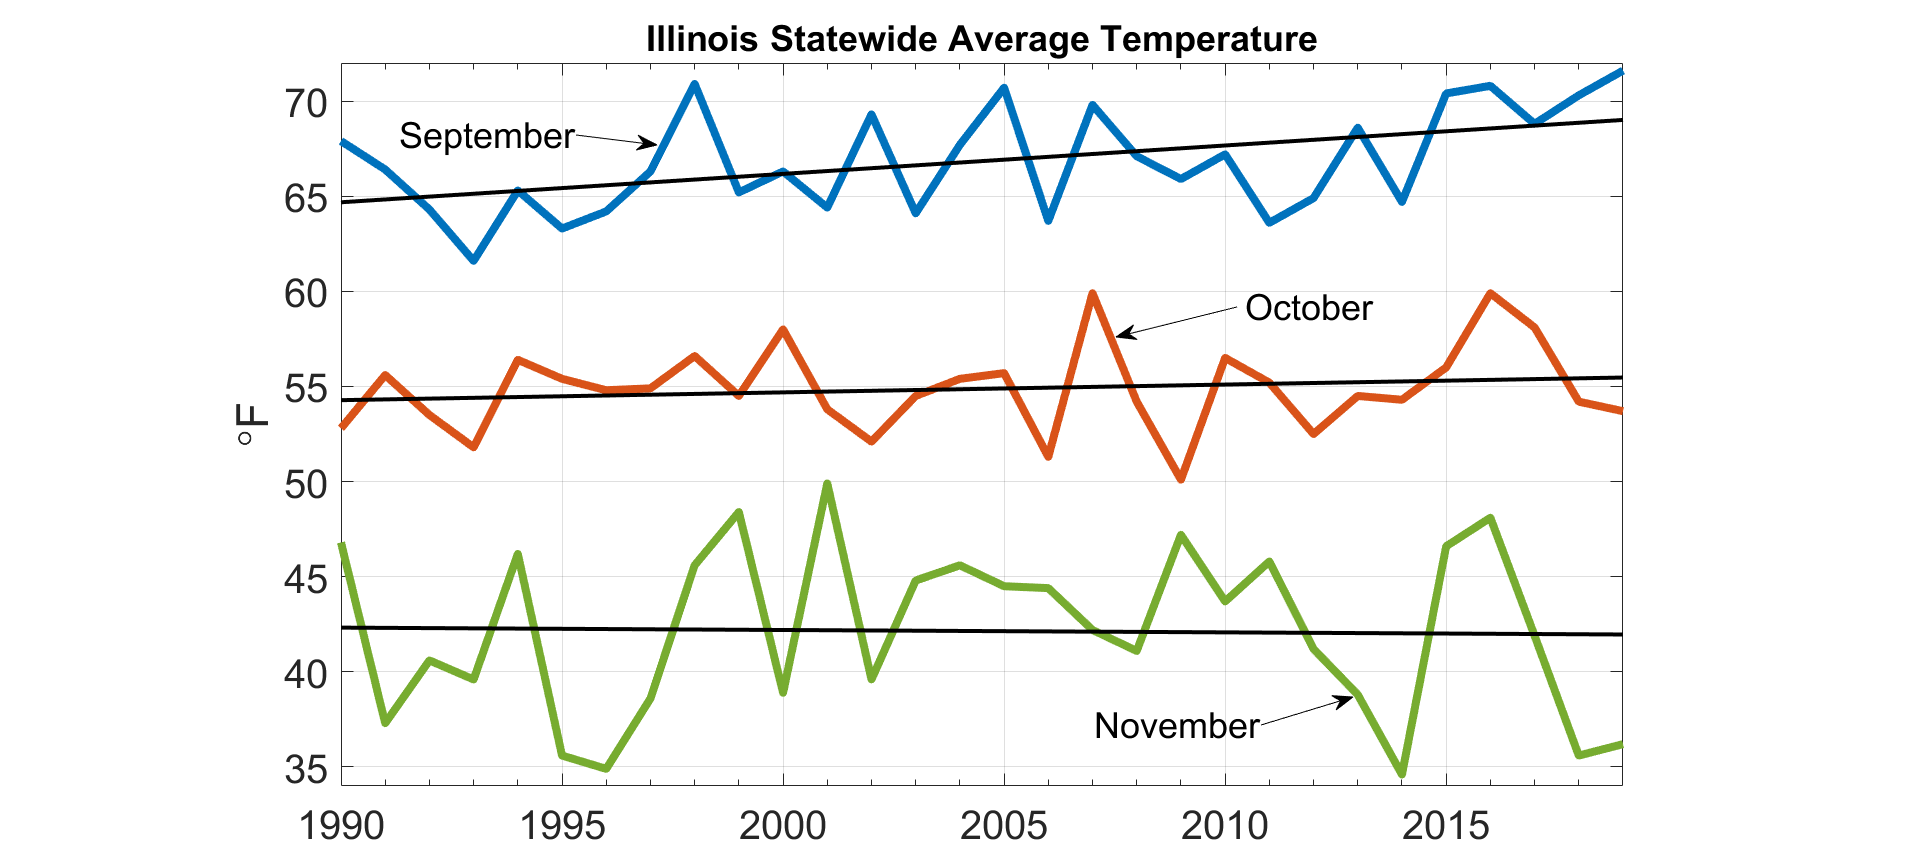
The plot below shows statewide monthly average temperature in September, October, and November between 1990 and 2019, with trends fitted to show recent temperature changes. September and October temperature have both increased over the past 30 years, whereas November temperature has decreased slightly. The largest magnitude of change is in September; over the past 30 years September average temperature in Illinois has increased at a rate of 1.5 degrees per decade.
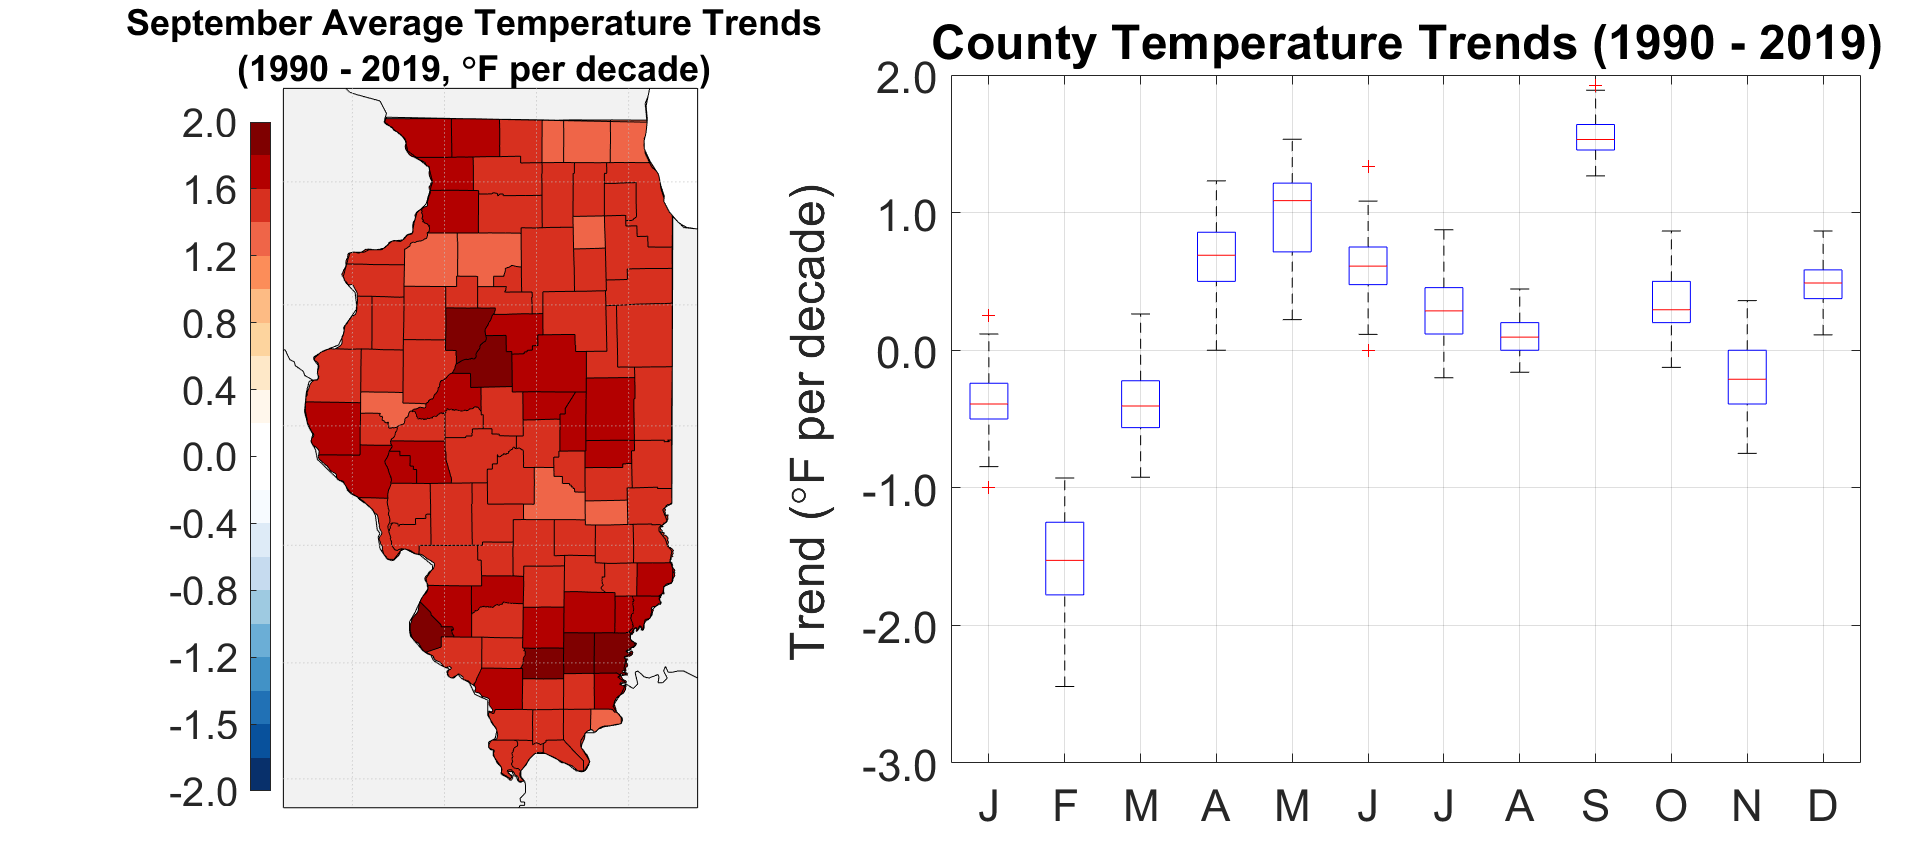
As the map below shows, all 102 Illinois counties have experienced a positive (i.e., warming) trend in September temperature over the past 30 years. From a different perspective, the figure next to the county map shows the distribution of all Illinois county temperature trends for each calendar month between 1990 and 2019.The boxplots show the range of temperature trends across all 102 counties for each calendar month. The boxplots clearly show that positive 30-year trends are largest in September, and all counties have a September temperature trend greater than or equal to 1.2 degrees per decade.
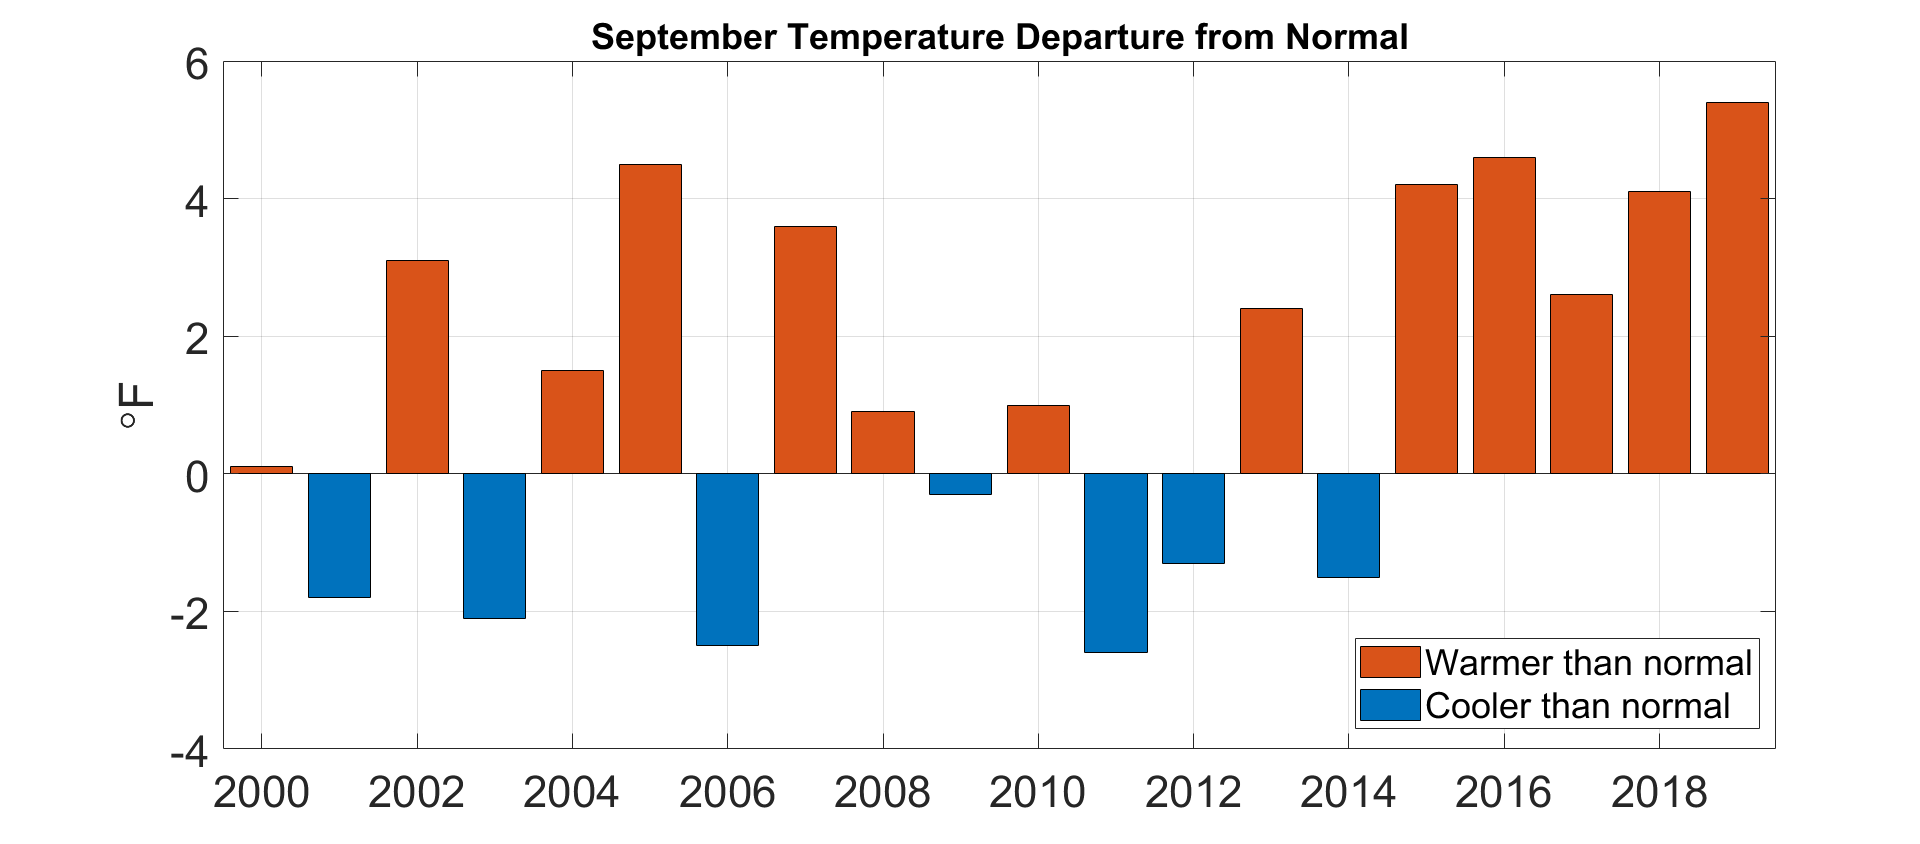
The plot below shows statewide September average temperatures between 2000 and 2019, depicted as a departure from the current (1981-2010) normal. The statewide average September temperature has been higher than the 30-year normal in 13 of the past 20 years, and each of the past five years. The average September temperature departure from the normal over the past five years is 4.2 degrees, and in four of the past five years, the September statewide average temperature has been closer to the August 30-year normal than the September normal.
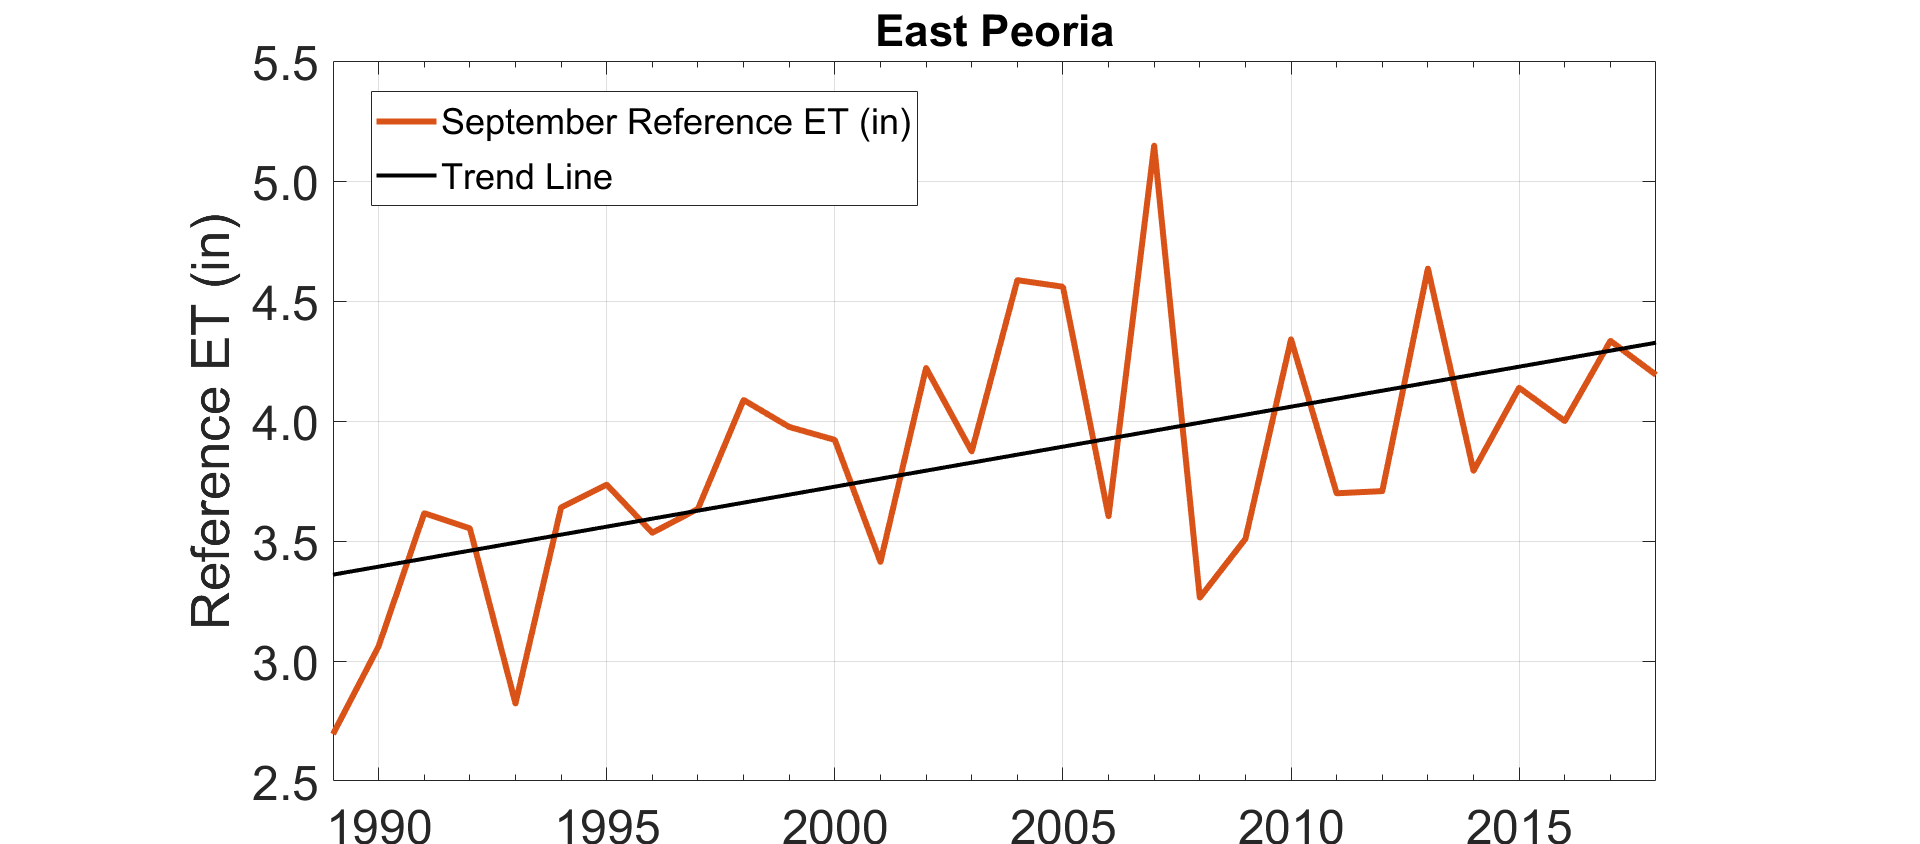
The figures and maps above agree with anecdotal evidence I’ve heard from folks around the state who have noticed recent Septembers have been unusually warm. This was particularly noteworthy last year, when a very warm September statewide was critical to help mature late-planted crops. However, higher September temperatures also increase atmospheric evaporative demand, which can intensify dry conditions. The plot below shows total September evaporative demand, represented by reference evapotranspiration (ET), estimated from measurements at the Illinois Climate Network station in East Peoria between 1989 and 2019. Reference ET in East Peoria has increased by 0.28 inches per decade between 1989 and 2019. All 19 Illinois Climate Network stations show similar evaporative demand trends over this time period.
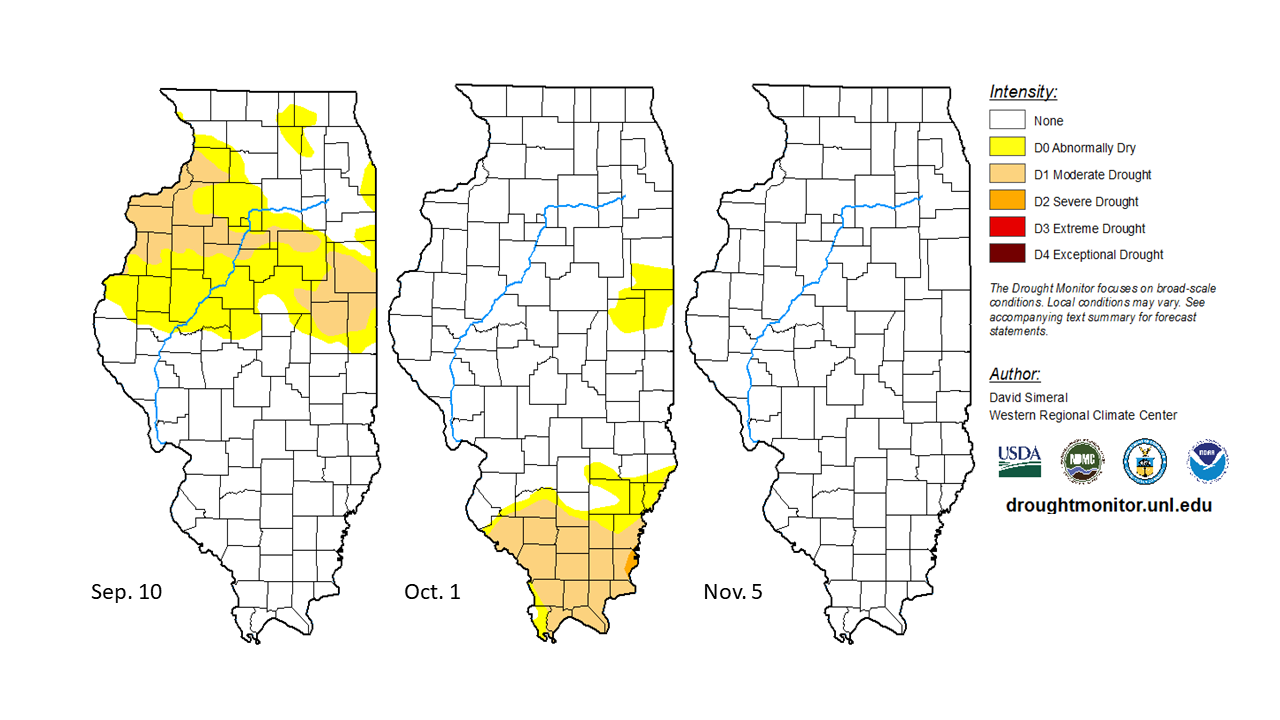
The importance of temperature and evaporative demand for drought played out in southern Illinois last year. Most counties south of Interstate 64 received 10 to 50 percent of normal September precipitation that combined with very high September temperatures to rapidly dry soil. The U.S. Drought Monitor maps below show the evolution of what could be called a “flash drought” last fall in southern Illinois, when many counties deteriorated from near normal conditions to severe drought in only three weeks. It is likely the drought in southern Illinois would not have intensified as quickly without the elevated September temperatures and high evaporative demand.
A consistent conclusion of recent climate assessments, including the 4th National Climate Assessment (https://nca2018.globalchange.gov/chapter/21/), is that increasing temperatures will exacerbate drought conditions, similar to what we witnessed last year in southern Illinois.
Fall Freeze Dates
Despite recent fall warming, studies have not consitently found a significant decrease in the frequency of very early fall freeze events in the central U.S. This may seem counterintuitive, but it provides a good example of the separation of variability and change. Daily, monthly, and inter-annual weather and climate variability exists on top of longer term change. Therefore, an early fall freeze is still very possible despite positive fall temperature trends. Thankfully, crops this year are much further along in their maturity than last year, so irrespective of fall freeze, there is overall less risk of crop damage. Still, as September approaches, it is a good time to review climatological fall freeze dates in Illinois.
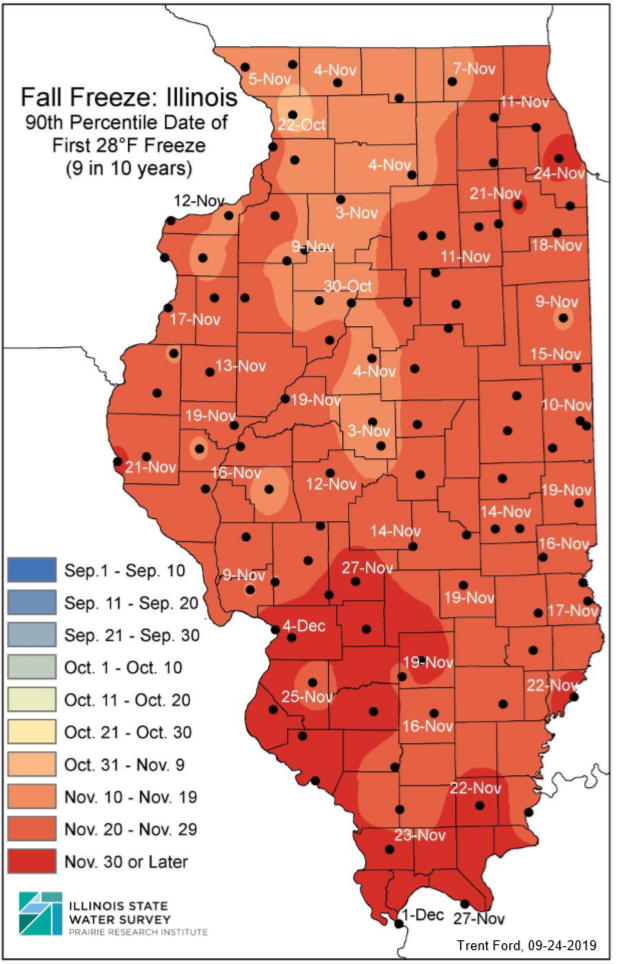
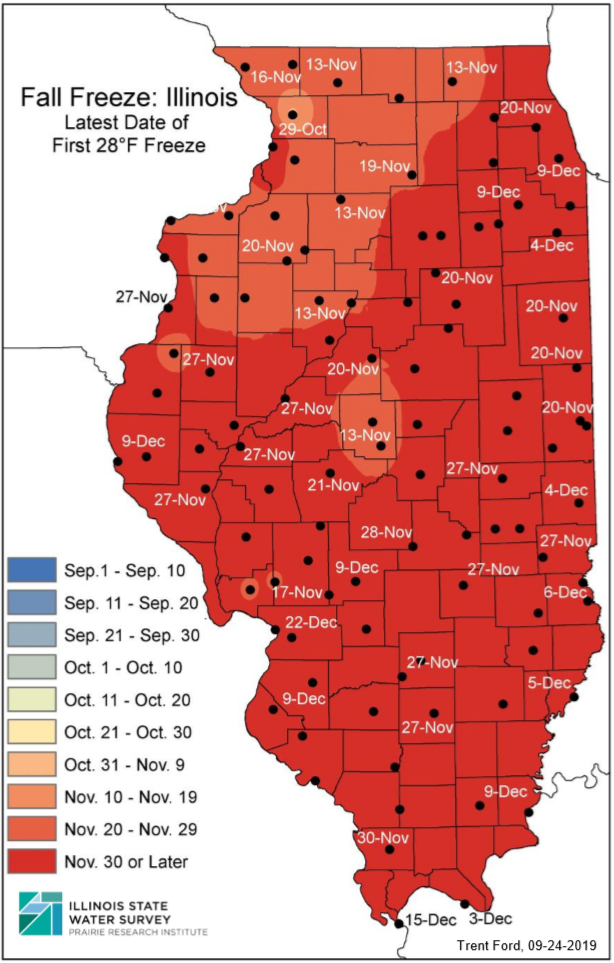
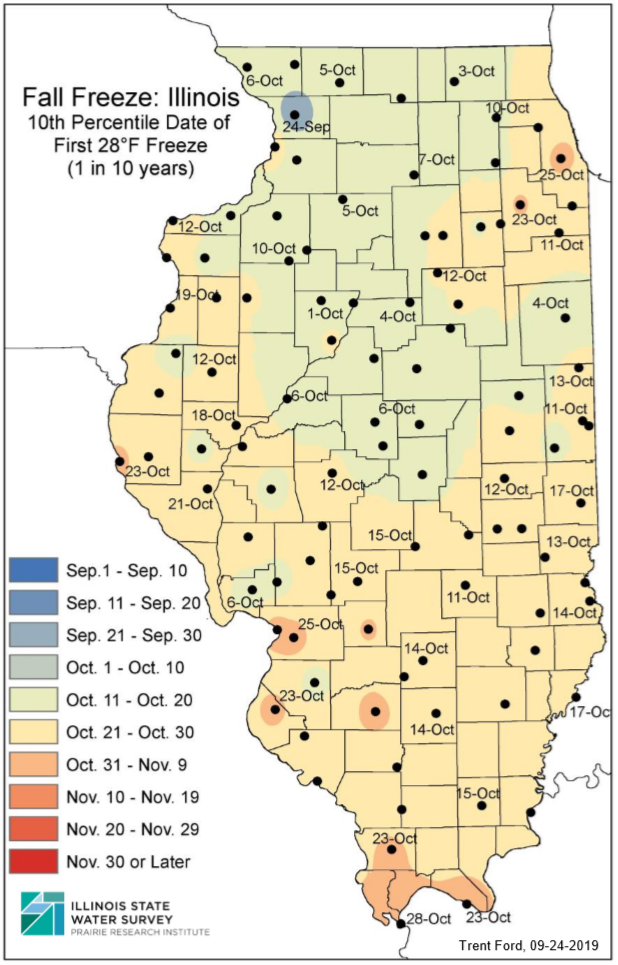
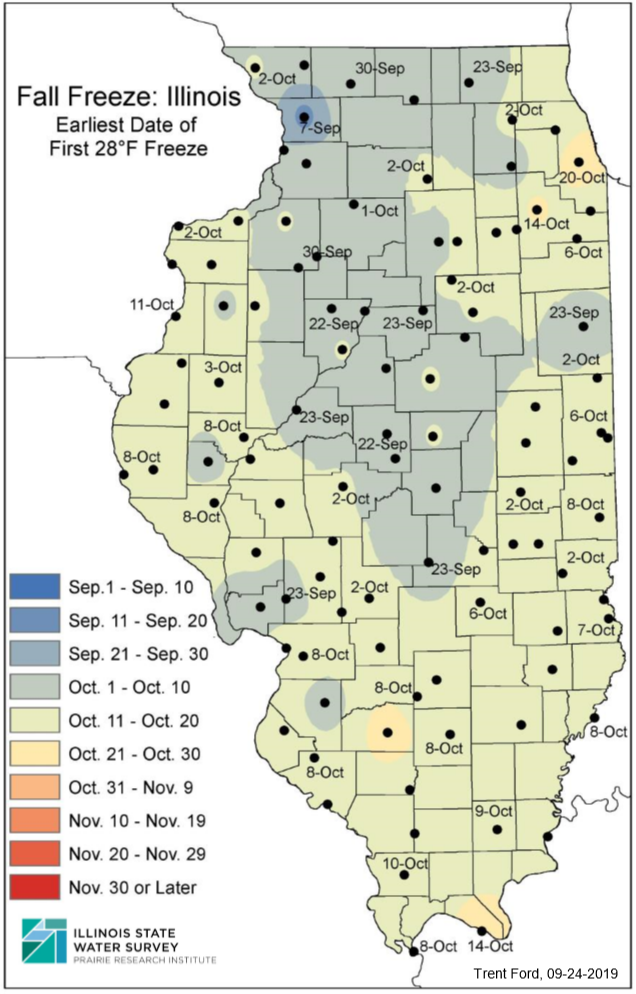
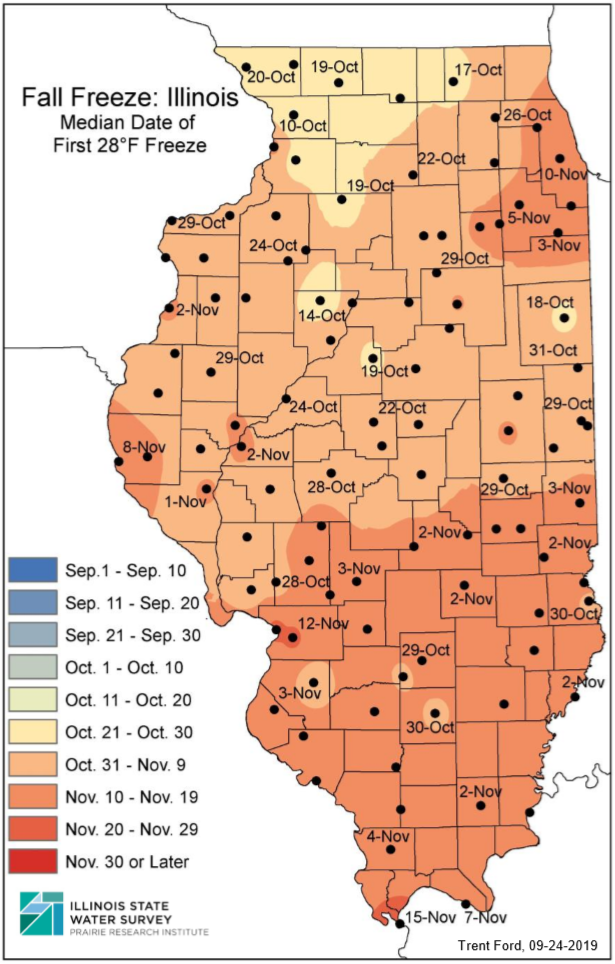
The maps below were created by the State Climatologist Office for a discussion on fall freeze dates last year (https://stateclimatologist.web.illinois.edu/2019/09/24/illinois-first-fall-freeze-climatology/). The maps show the climatological earliest and latest first fall freeze dates, the median date, and the dates which represent 1 in 10 and 9 in 10-year events. The climatological period is 1979 and 2018. Although 2019 data are not included, all areas of the state experienced their first fall freeze event within days of the climatological median, so the exclusion of 2019 will not drastically affect the numbers.
The earliest fall freeze dates over the past 40 years range from late September in northwest and central Illinois to early October in southern and eastern Illinois. The tenth percentile (i.e., 1 in 10 years) first fall freeze dates range from early October in northern and central areas to late October in southern Illinois. Median first fall freeze dates range from mid- to late October in northwest and central Illinois to early November in southern and northeastern Illinois.
The 90th percentile first fall freeze dates (i.e., 9 in 10 years) range from early November in northwest and central areas to mid- to late November in southern areas. One way to think about the 9 in 10-year maps is that 90 percent of all years in the climatological record have recorded the first fall freeze before that date. Finally, the latest first fall freeze dates range from mid- to late November in northwest Illinois to mid-December in southern Illinois.
